|

Silver Price Analysis: XAG/USD remains below multi-month-old descending trend-line resistance

  • XAG/USD attracts fresh buying on Tuesday and reverses the previous day’s slide.
  • The technical setup favours bullish traders and supports prospects for further gains.
  • A move beyond a descending trend-line is needed to reaffirm the positive outlook.

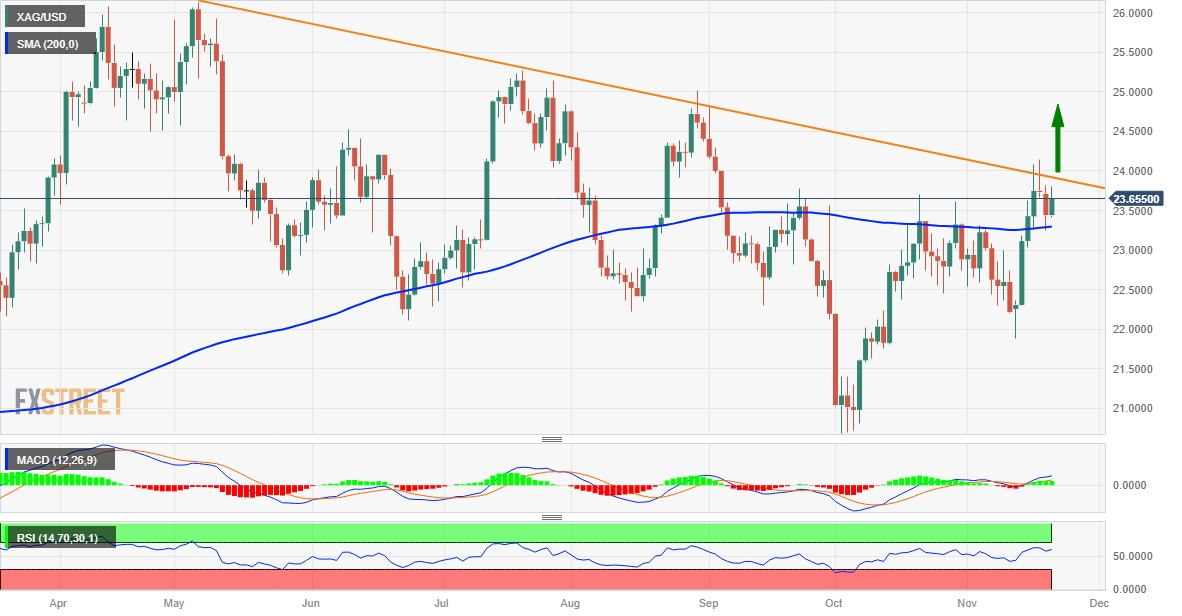
Silver (XAG/USD) regains positive traction on Tuesday to reverse the previous day's losses and maintains its bid tone through the first half of the European session. The white metal currently trades around the $23.65-$23.70 region, up 1.0% for the day, and seems poised to appreciate further.

From a technical perspective, the recent pullback from the $24.15 region, or the highest level since September 4, stalled near the very important 200-day Simple Moving Average (SMA) resistance breakpoint, now turned support. The subsequent move up favours bullish traders and supports prospects for a further appreciating move. Moreover, oscillators on the daily chart are holding in the positive territory and are still far from being in the overbought zone, validating the positive outlook for the XAG/USD.

Bulls, however, might wait for a sustained breakout through a downward-sloping trend line extending from the May swing high, currently pegged near the $24.00 mark, before placing fresh bets. The XAG/USD might then aim to surpass the $24.20-$24.25 intermediate resistance and make a fresh attempt towards conquering the $25.00 psychological mark. Some follow-through buying beyond the $25.15-$25.20 region should set the stage for a move towards reclaiming the $26.00 round figure for the first time since May.

On the flip side, the 200-day SMA, currently pegged near the $23.30 region, might continue to protect the immediate downside. Any further decline might still be seen as a buying opportunity and remain limited near the $23.00 mark. That said, a convincing break below the latter might prompt aggressive technical selling and drag the XAG/USD further towards the $22.35-$22.30 zone en route to the $22.00 mark.

Silver daily chart

fxsoriginal

Technical levels to watch

XAG/USD

Overview
Today last price23.67
Today Daily Change0.23
Today Daily Change %0.98
Today daily open23.44
 
Trends
Daily SMA2022.98
Daily SMA5022.7
Daily SMA10023.22
Daily SMA20023.29
 
Levels
Previous Daily High23.81
Previous Daily Low23.25
Previous Weekly High24.15
Previous Weekly Low21.88
Previous Monthly High23.7
Previous Monthly Low20.68
Daily Fibonacci 38.2%23.46
Daily Fibonacci 61.8%23.6
Daily Pivot Point S123.19
Daily Pivot Point S222.93
Daily Pivot Point S322.62
Daily Pivot Point R123.76
Daily Pivot Point R224.07
Daily Pivot Point R324.32

Author

Haresh Menghani

Haresh Menghani is a detail-oriented professional with 10+ years of extensive experience in analysing the global financial markets.

More from Haresh Menghani
Share:

Markets move fast. We move first.

Orange Juice Newsletter brings you expert driven insights - not headlines. Every day on your inbox.

By subscribing you agree to our Terms and conditions.

Editor's Picks

EUR/USD holds steady near 1.1750 on first trading day of 2026

EUR/USD stays calm on Friday and trades in a narrow channel at around 1.1750 as trading conditions remain thin following the New Year holiday and ahead of the weekend. The economic calendar will not feature any high-impact data releases.

GBP/USD struggles to gain traction, stabilizes above 1.3450

After testing 1.3400 on the last day of 2025, GBP/USD managed to stage a rebound. Nevertheless, the pair finds it difficult to gather momentum and moves sideways above 1.3450 as market participants remain in holiday mood.

Gold climbs toward $4,400 following deep correction

Gold reverses its direction and advances toward $4,400 after suffering heavy losses amid profit-taking before the New Year holiday. Growing expectations for a dovish Fed policy and persistent geopolitical risks seem to be helping XAU/USD stretch higher.

Cardano gains early New Year momentum, bulls target falling wedge breakout

Cardano kicks off the New Year on a positive note and is extending gains, trading above $0.36 at the time of writing on Friday. Improving on-chain and derivatives data point to growing bullish interest, while the technical outlook keeps an upside breakout in focus.

Economic outlook 2026-2027 in advanced countries: Solidity test

After a year marked by global economic resilience and ending on a note of optimism, 2026 looks promising and could be a year of solid economic performance. In our baseline scenario, we expect most of the supportive factors at work in 2025 to continue to play a role in 2026.

Crypto market outlook for 2026

Year 2025 was volatile, as crypto often is.  Among positive catalysts were favourable regulatory changes in the U.S., rise of Digital Asset Treasuries (DAT), adoption of AI and tokenization of Real-World-Assets (RWA).