|

Silver Price Analysis: XAG/USD recovers some ground as doji emerges and is subject to remaining subdued

  • Silver (XAG/USD) stages a modest recovery after July’s US jobs data missed estimates, trading at $23.57, bouncing off the 200-day EMA at $23.18.
  • Technical outlook shifts to neutral-upward bias, as the metal remains above the 200-day EMA and July 6 low of $22.53.
  • Key resistance lies at the 100-day EMA at $23.67, followed by the 50 and 20-day EMAs at $23.90 and $24.07 respectively. Support is found at the 200-day EMA and $23.00 mark.

Silver price is staging a slight recovery on Friday after US jobs data for July missed estimates, spurring XAG/USD’s bounce at around the 200-day Exponential Moving Average (EMA) at $23.18 a troy ounce as US Treasury bond yields tank. The XAG/USD is exchanging hands at $23.57 after hitting a daily low of $23.23.

XAG/USD Price Analysis: Technical outlook

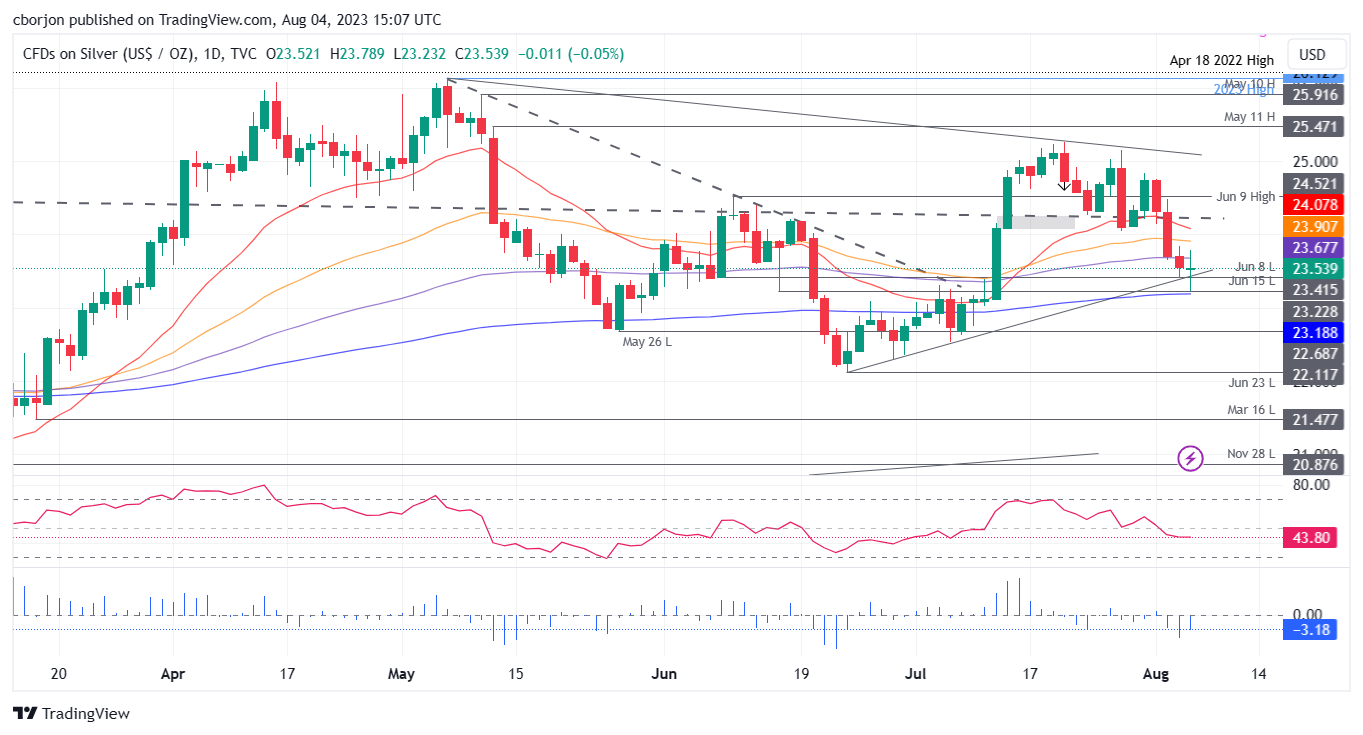
From a technical perspective, XAG/USD bias shifted to neutral biased as long as buyers keep prices from diving below the 200-day EMA and above the July 6 low of $22.53. Even though XAG/USD is trimming some losses, It remains subject to further selling pressure, with the 100-day EMA at $23.67 capping any Silver’s rallies and the Relative Strength Index (RSI) indicating that sellers remain in charge.

If XAG/USD reclaims the 100-day EMA, that will put into play two more daily EMAs acting as resistance, the 50 and the 20-day EMAs, each at $23.90 and $24.07, respectively. Conversely, buyers’ failure at $23.67 could send the white metal slumping toward the 200-day EMA, ahead of challenging the $23.00 figure.

XAG/USD Price Action – Daily chart

XAG/USD Daily chart

XAG/USD

Overview
Today last price23.58
Today Daily Change0.01
Today Daily Change %0.04
Today daily open23.57
 
Trends
Daily SMA2024.32
Daily SMA5023.72
Daily SMA10024.03
Daily SMA20023.15
 
Levels
Previous Daily High23.84
Previous Daily Low23.41
Previous Weekly High25.15
Previous Weekly Low24.04
Previous Monthly High25.27
Previous Monthly Low22.52
Daily Fibonacci 38.2%23.57
Daily Fibonacci 61.8%23.68
Daily Pivot Point S123.37
Daily Pivot Point S223.17
Daily Pivot Point S322.94
Daily Pivot Point R123.81
Daily Pivot Point R224.04
Daily Pivot Point R324.24

Author

Christian Borjon Valencia

Markets analyst, news editor, and trading instructor with over 14 years of experience across FX, commodities, US equity indices, and global macro markets.

More from Christian Borjon Valencia
Share:

Editor's Picks

AUD/USD falls to near 0.7100 after slipping below 50-day EMA

AUD/USD depreciates after registering minor gains in the previous day, trading around 0.7120 during the Asian hours. The technical analysis of the daily chart shows the pair consolidating sideways within a rectangle pattern, as neither bulls nor bears gain control. The AUD/USD pair is holding a slight bearish tone however as it sits beneath both the nine-day and 50-day EMAs.

160.00: USD/JPY back near intervention territory after upbeat US jobs report

US Nonfarm Payrolls beat expectations by a wide margin in May, with 172K jobs added. The US Dollar rebounds after the release, helping USD/JPY recover from its intraday lows. Warnings from Japanese authorities continue to limit upside potential near the 160.00 threshold.

Gold targets $4,300 amid stronger Dollar

Gold faces increasing selling interest and navigates the area of three-month lows near the $4,300 mark per troy ounce on Friday. The precious metal’s decline comes as traders assess the stronger-than-expected NFP, while the bid bias in the Greenback and higher US Treasury yields also collaborate with the retracement.

Cardano hits five-year low even as Hoskinson clarifies "break" isn't an exit

Cardano (ADA) price is down 10% at press time on Friday, extending losses over 30% so far this week amid Charles Hoskinson's clarification that "break" isn't an exit.

Week ahead – Fed countdown begins amid US inflation data and geopolitical risks

Fed Chair Warsh’s first meeting approaches as key US inflation data could reshape expectations. Oil prices remain elevated as US-Iran talks continue; tariffs also return to the spotlight. ECB is expected to hike; will it be a one-off move or is July live?

The US economy defies the rules: 100 days into the Oil shock and the recession signal is still missing

More than three months after the start of the Iran war and the resulting disruption to global energy markets, the US economy continues to display remarkable resilience. The conflict has triggered a sharp rise in Oil prices, reignited inflationary pressures and fueled widespread concerns about a potential economic slowdown.