- Siler gains traction for the second straight day and recovers further from the YTD low.
- The setup favours bearish traders and supports prospects for further near-term losses.
- A sustained strength beyond the $22.00 confluence could negate the negative outlook.
Silver builds on the previous day's recovery move from the $20.40 area, or a nearly four-month low and scales higher for the second successive day on Wednesday. The white metal, however, trims a part of its intraday gains and trades around the $21.00 mark, still up nearly 0.50% for the day heading into the North American session.
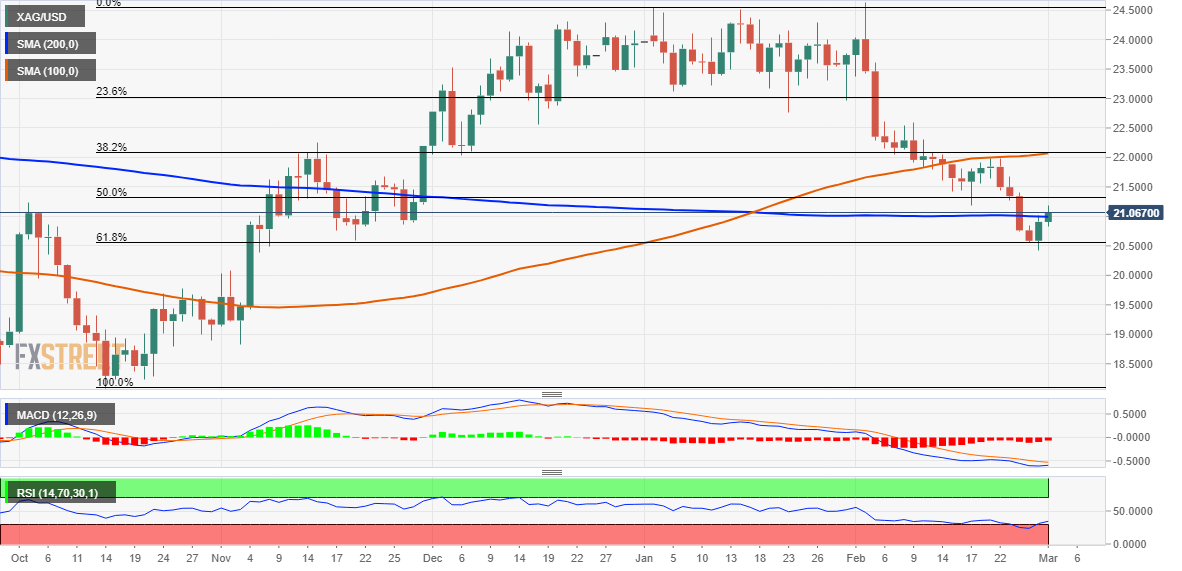
Looking at the broader picture, the XAG/USD on Tuesday showed some resilience below the 61.8% Fibonacci retracement level of the recent rally from the October 2022 low. The said support, around the $20.60 area, should now act as a pivotal point. Given that technical indicators on the daily chart have recovered from the oversold zone and are still holding deep in the negative territory, the bias still seems tilted in favour of bearish traders.
Hence, the ongoing recovery move is more likely to confront stiff resistance near 50% Fibo. level, around the $21.35 region, ahead of the mid-$21.00s. Any subsequent strength could be seen as a selling opportunity and runs the risk of fizzling out near the $22.00 confluence support breakpoint. The said handle comprises 100-day Simple Moving Average (SMA) and 38.2% Fibo. level, which if cleared could negate the near-term bearish bias.
A sustained strength beyond could trigger a short-covering rally and lift the XAG/USD towards the $22.55-$22.60 supply zone. Bulls might eventually aim to reclaim the $23.00 round-figure mark, which coincides with the 23.6% Fibo. level.
On the flip side, 61.8% Fibo. level, around the $20.60 area, now seems to protect the immediate downside. Some follow-through selling below the overnight swing low, around the $20.40 region, should make the XAG/USD vulnerable to weaken further. The downward trajectory should pave the way for a fall below the $20.00 psychological mark, towards testing the next relevant support near the $19.75-$19.70 region.
Silver daily chart
Key levels to watch
Information on these pages contains forward-looking statements that involve risks and uncertainties. Markets and instruments profiled on this page are for informational purposes only and should not in any way come across as a recommendation to buy or sell in these assets. You should do your own thorough research before making any investment decisions. FXStreet does not in any way guarantee that this information is free from mistakes, errors, or material misstatements. It also does not guarantee that this information is of a timely nature. Investing in Open Markets involves a great deal of risk, including the loss of all or a portion of your investment, as well as emotional distress. All risks, losses and costs associated with investing, including total loss of principal, are your responsibility. The views and opinions expressed in this article are those of the authors and do not necessarily reflect the official policy or position of FXStreet nor its advertisers. The author will not be held responsible for information that is found at the end of links posted on this page.
If not otherwise explicitly mentioned in the body of the article, at the time of writing, the author has no position in any stock mentioned in this article and no business relationship with any company mentioned. The author has not received compensation for writing this article, other than from FXStreet.
FXStreet and the author do not provide personalized recommendations. The author makes no representations as to the accuracy, completeness, or suitability of this information. FXStreet and the author will not be liable for any errors, omissions or any losses, injuries or damages arising from this information and its display or use. Errors and omissions excepted.
The author and FXStreet are not registered investment advisors and nothing in this article is intended to be investment advice.
Recommended content
Editors’ Picks
EUR/USD steady below 1.0800 after US PCE meets expectations
EUR/USD remains depressed below 1.0800 after soft French inflation data, amid minimal volatility and thin liquidity on Good Friday. The pair barely reacted to US PCE inflation data, with the Greenback shedding some pips. Fed Chair Jerome Powell set to speak ahead of the weekly close.
GBP/USD hovers around 1.2620 in dull trading
GBP/USD trades sideways above 1.2600 amid a widespread holiday restraining action across financial markets. Investors took a long weekend ahead of critical United States employment data next week. Fed Chair Powell coming up next.
Gold price sits at all-time highs above $2,230
Gold price holds near a fresh all-time high at $2,236 in thinned trading amid the Easter Holiday. Most major world markets remain closed, although the United States published core PCE inflation, the Federal Reserve’s favorite inflation gauge.
Jito price could hit $6 as JTO coils up inside this bullish pattern
Jito (JTO) price has been on an uptrend since forming a local bottom in early January. Since then, JTO has revisited the key swing point formed in early December, suggesting the bulls’ intention to move higher.
Key events in developed markets next week
Next week, the main focus will be inflation and the labour market in the Eurozone. We expect services inflation to be impacted by the easter effect, while the unemployment rate to be unchanged.