|

Silver Price Analysis: XAG/USD rebounds from 7-week high, back above $22.00

  • Silver prices recover, trading at approximately $22.32 an ounce, marking a 0.27% gain after touching five-week lows at $21.88.
  • Technical analysis reveals a neutral to downward bias, but a 'hammer' pattern formation on the daily chart suggests potential bullish momentum.
  • For a bullish shift, silver needs to surpass the 50-day moving average (DMA) at $22.65, targeting the 200-DMA at $23.25 and the October 20 high at $23.69.

Silver price finds its foot and rises after reaching five-week lows at $21.88 on Monday, and exchanges hands at around $22.32 a troy ounce, late during the North American session, printing gains of 0.27%, at the time of writing.

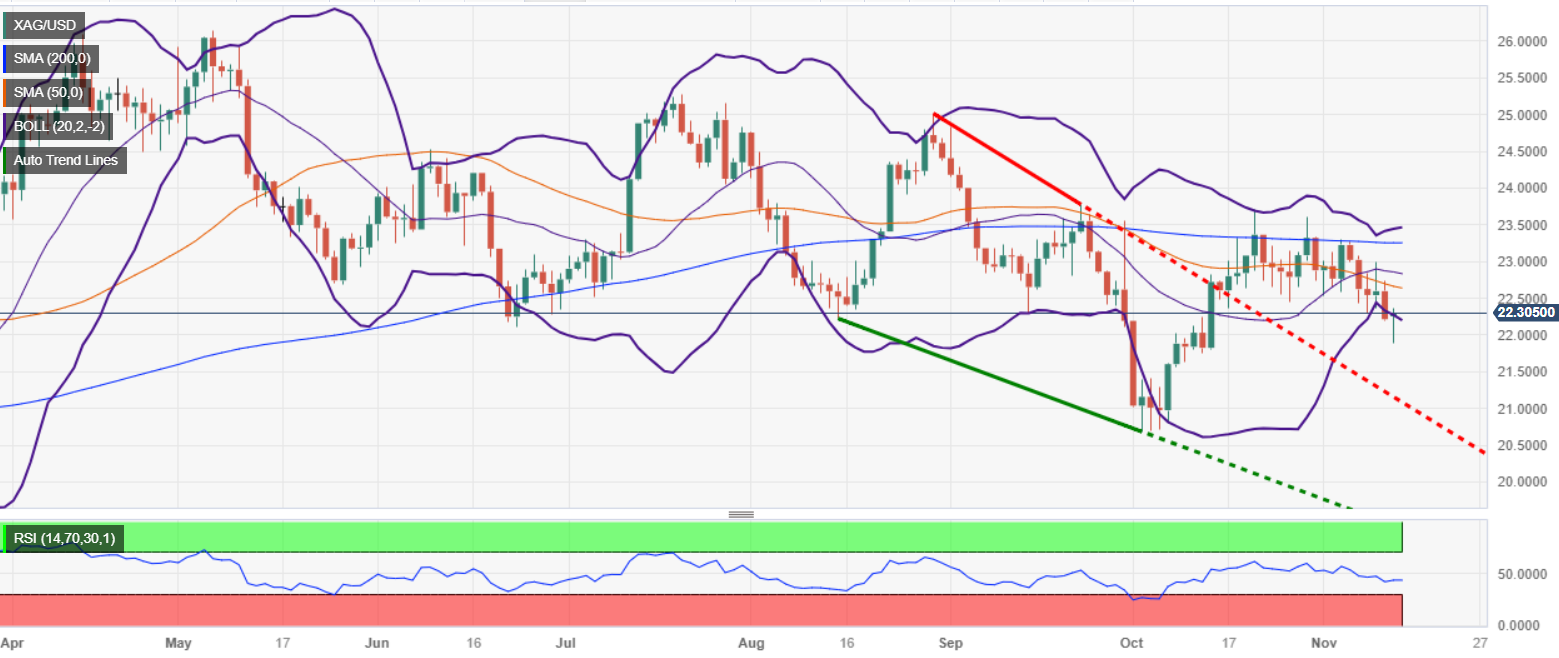
From a technical standpoint, the grey’s metal is neutral to downward biased, but the daily chart portrays price action is forming a ‘hammer,’ usually a bullish signal, after posting a series of seven successive days registering lower highs and lows, that ended on Monday.

Hence, if XAG/USD would turn bullish, buyers must initially reclaim the 50-day moving average (DMA) at $22.65. A breach of the latter would expose the 200-DMA at $23.25, followed by October 20, the latest cycle high at $23.69. Once cleared, a bullish resumption would be underway.

On the other hand, a drop below the October 13 low of $21.87, would cement a bearish case, with sellers next target being the October 4 swing low of $20.69, followed by the year-to-date (YTD) low of $19.90.

XAG/USD Price Analysis – Daily Chart

XAG/USD Technical Levels

XAG/USD

Overview
Today last price22.32
Today Daily Change0.10
Today Daily Change %0.45
Today daily open22.22
 
Trends
Daily SMA2022.87
Daily SMA5022.7
Daily SMA10023.19
Daily SMA20023.25
 
Levels
Previous Daily High22.74
Previous Daily Low22.19
Previous Weekly High23.26
Previous Weekly Low22.19
Previous Monthly High23.7
Previous Monthly Low20.68
Daily Fibonacci 38.2%22.4
Daily Fibonacci 61.8%22.53
Daily Pivot Point S122.02
Daily Pivot Point S221.83
Daily Pivot Point S321.47
Daily Pivot Point R122.57
Daily Pivot Point R222.93
Daily Pivot Point R323.12

Author

Christian Borjon Valencia

Christian Borjon began his career as a retail trader in 2010, mainly focused on technical analysis and strategies around it. He started as a swing trader, as he used to work in another industry unrelated to the financial markets.

More from Christian Borjon Valencia
Share:

Markets move fast. We move first.

Orange Juice Newsletter brings you expert driven insights - not headlines. Every day on your inbox.

By subscribing you agree to our Terms and conditions.

Editor's Picks

EUR/USD climbs toward 1.1800 on broad USD weakness

EUR/USD gathers bullish momentum and advances toward 1.1800 in the second half of the day on Tuesday. The US Dollar weakens and helps the pair stretch higher after the employment report showed that Nonfarm Payrolls declined by 105,000 in October before rising by 64,000 in November.

GBP/USD climbs to fresh two-month high above 1.3400

GBP/USD gains traction in the American session and trades at its highest level since mid-October above 1.3430. The British Pound benefits from upbeat PMI data, while the US Dollar struggles to find demand following the mixed employment figures and weaker-than-forecast PMI prints, allowing the pair to march north.

Gold extends its consolidative phase around $4,300

Gold trades in positive above $4,300 after spending the first half of the day under bearish pressure. XAU/USD capitalizes on renewed USD weakness after the jobs report showed that the Unemployment Rate climbed to 4.6% in November and the PMI data revealed a loss of growth momentum in the private sector in December. 

XRP dips as bearish pressure persists despite ETF growth

Ripple is finding footing above $1.90 at the time of writing on Tuesday after a bearish wave swept across the broader cryptocurrency market, building on persistent negative sentiment.

Ukraine-Russia in the spotlight once again

Since the start of the week, gold’s price has moved lower, but has yet to erase the gains made last week. In today’s report we intend to focus on the newest round of peace talks between Russia and Ukraine, whilst noting the release of the US Employment data later on day and end our report with an update in regards to the tensions brewing in Venezuela.

BNB Price Forecast: BNB slips below $855 as bearish on-chain signals and momentum indicators turn negative

BNB, formerly known as Binance Coin, continues to trade down around $855 at the time of writing on Tuesday, after a slight decline the previous day. Bearish sentiment further strengthens as BNB’s on-chain and derivatives data show rising retail activity.