NZD/USD Price Forecast: Falls to near 0.5850 after slipping below moving averages
- NZD/USD may fall toward the lower boundary of the rectangle around 0.5810.
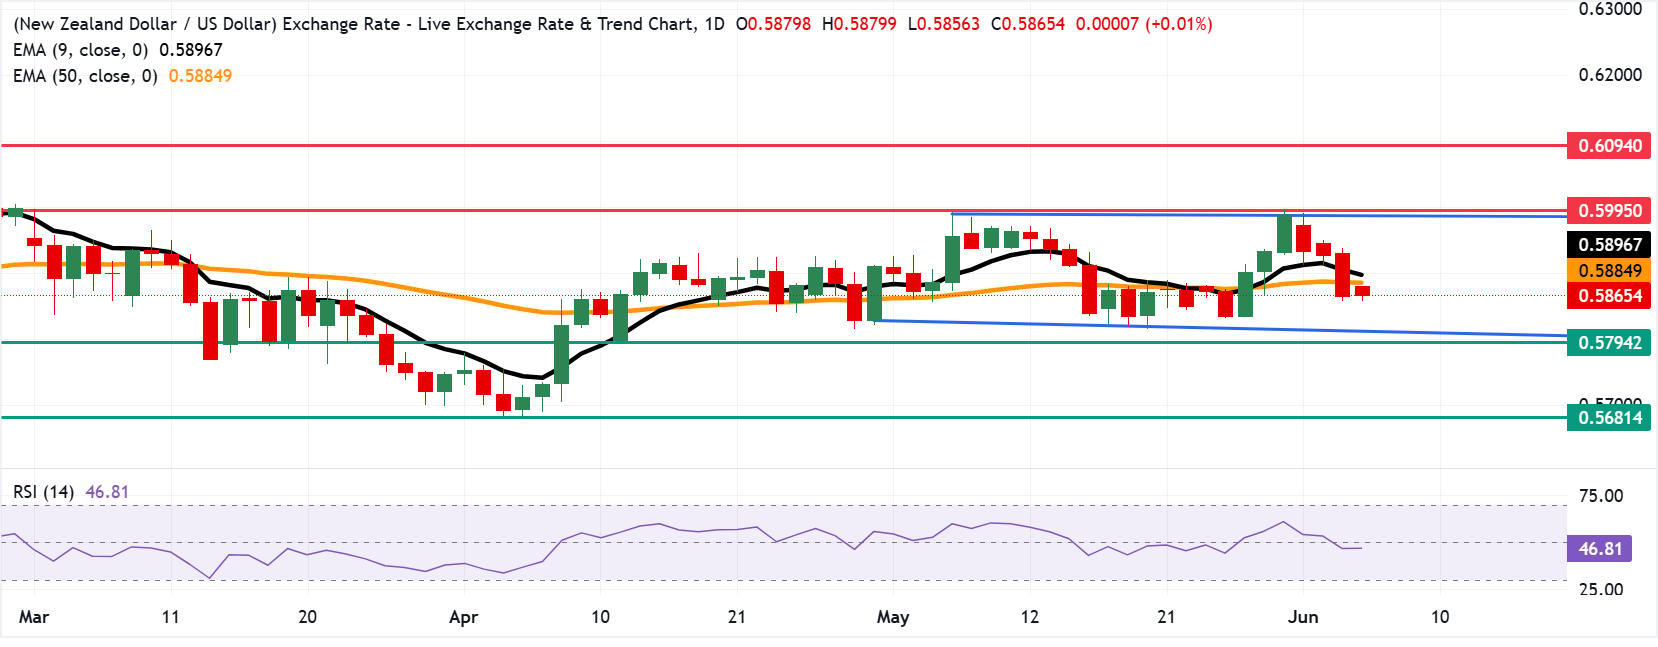
- The 14-day Relative Strength Index hovers just below the 50 mark, signaling that bearish momentum still maintains control.
- The immediate barrier lies at the 50- and nine-day EMAs of 0.5884 and 0.5896, respectively.

NZD/USD extends its losses for the fourth successive day, trading around 0.5860 during the European hours on Thursday. The technical analysis of the daily chart shows the spot price moving sideways within a rectangle pattern, indicating a period of market consolidation and indecision.
The NZD/USD pair is keeping a mild bearish bias as it holds beneath the short-term and medium-term Exponential Moving Averages (EMAs), clustering just above the spot as immediate overhead supply, suggesting rallies are likely to meet selling interest while price trades below this band.
Momentum is soft, with the 14-day Relative Strength Index (14) hovering just under the 50 line, hinting that downside pressure still dominates even if selling lacks a strongly oversold tone.
The NZD/USD pair may fall toward the lower boundary of the rectangle around 0.5810, followed by the seven-week low of 0.5794, recorded on April 13. A break below this confluence support zone would put downward pressure on the pair to navigate the region around a six-month low of 0.5681, which was recorded on April 6.
On the upside, the NZD/USD pair may rebound toward the immediate barrier at the 50-day EMA of 0.5884, followed by the nine-day EMA at 0.5896. A successful break above these moving averages could support the pair to test the upper boundary of the rectangle around 0.5990, followed by the three-month high of 0.6014, which was reached on February 26.
(The technical analysis of this story was written with the help of an AI tool.)
New Zealand Dollar Price Today
The table below shows the percentage change of New Zealand Dollar (NZD) against listed major currencies today. New Zealand Dollar was the weakest against the Japanese Yen.
| USD | EUR | GBP | JPY | CAD | AUD | NZD | CHF | |
|---|---|---|---|---|---|---|---|---|
| USD | -0.06% | -0.04% | -0.11% | 0.17% | -0.03% | -0.02% | -0.03% | |
| EUR | 0.06% | 0.01% | -0.06% | 0.23% | 0.00% | -0.05% | 0.03% | |
| GBP | 0.04% | -0.01% | -0.06% | 0.22% | 0.00% | -0.07% | 0.00% | |
| JPY | 0.11% | 0.06% | 0.06% | 0.28% | 0.06% | -0.01% | 0.08% | |
| CAD | -0.17% | -0.23% | -0.22% | -0.28% | -0.21% | -0.28% | -0.20% | |
| AUD | 0.03% | -0.00% | -0.00% | -0.06% | 0.21% | -0.05% | 0.03% | |
| NZD | 0.02% | 0.05% | 0.07% | 0.01% | 0.28% | 0.05% | 0.07% | |
| CHF | 0.03% | -0.03% | -0.01% | -0.08% | 0.20% | -0.03% | -0.07% |
The heat map shows percentage changes of major currencies against each other. The base currency is picked from the left column, while the quote currency is picked from the top row. For example, if you pick the New Zealand Dollar from the left column and move along the horizontal line to the US Dollar, the percentage change displayed in the box will represent NZD (base)/USD (quote).
Author

Akhtar Faruqui
FXStreet
Akhtar Faruqui is a Forex Analyst based in New Delhi, India. With a keen eye for market trends and a passion for dissecting complex financial dynamics, he is dedicated to delivering accurate and insightful Forex news and analysis.


