|

Silver Price Analysis: XAG/USD rally stalls amidst positive US data as bearish signals emerge

  • XAG/USD risks a bearish-engulfing pattern and double-top formation as the price retreats from a 12-month high.
  • A downward path is anticipated, with crucial support levels at $25.00 and $24.00 amid fading buying momentum.

Silver price retreats after reaching a 12-month new high at $26.13 in the New York session. An improvement in the US labor market due to an upbeat US jobs report trumped XAG’s chances to test last year’s high. At the time of writing, the XAG/USD is trading at $25.60, down 1.69%.

XAG/USD Price Action

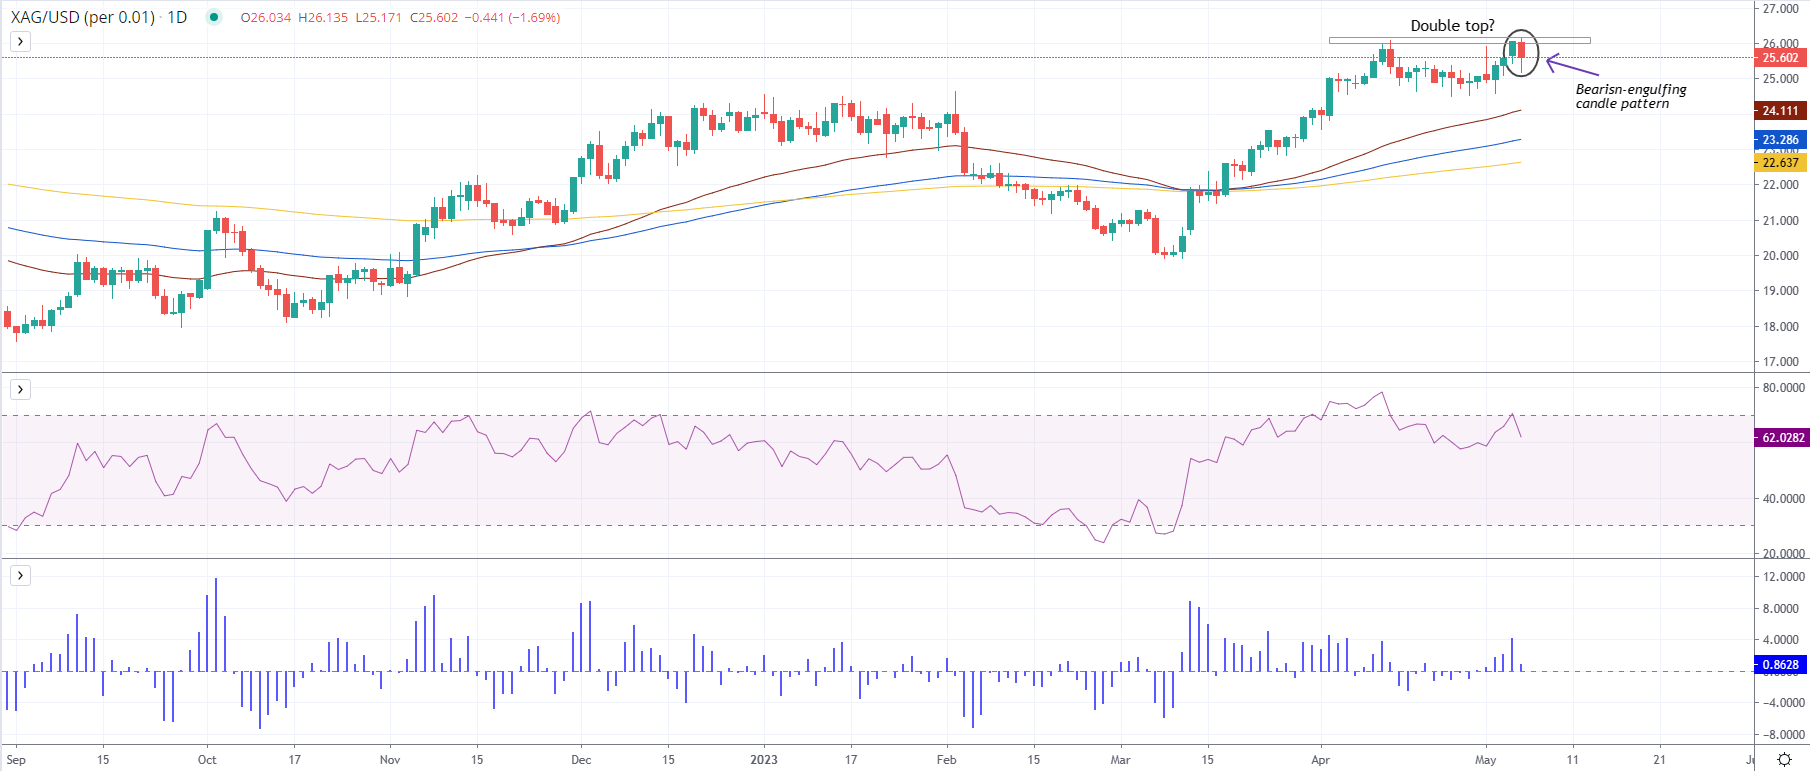
As of writing, XAG/USD is still upward biased but at the brisk of a pullback. If XAG/USD registers a daily close below the May 4 daily low of $25.44, that could form two bearish signals: firstly, a bearish-engulfing candle pattern which suggests that downward action is warranted. The second is the possible formation of a double-top, a major reversal chart pattern, which could drive prices toward the $24.00 figure.

The Relative Strength Index (RSI) indicator added another signal to the mix, forming a negative divergence. This means that as XAG/USD’s price action reached successive higher highs, the RSI peaked at lower highs as buying momentum faded. Additionally, the 3-day Rate of Change (RoC) shows that buying pressure is waning as sellers move into action.

Therefore, XAG/USD’s path of least resistance is downwards. The first support would be the $25.00 mark. A breach of the latter would expose the April 25 swing low of $24.49, followed by the 50-day Exponential Moving Average (EMA) at $24.11, which, once cleared and XAG/USD’s will challenge the $24.00 figure.

XAG/USD Daily Chart

XAG/USD Daily chart

XAG/USD

Overview
Today last price25.6
Today Daily Change-0.44
Today Daily Change %-1.69
Today daily open26.04
 
Trends
Daily SMA2025.23
Daily SMA5023.37
Daily SMA10023.3
Daily SMA20021.7
 
Levels
Previous Daily High26.06
Previous Daily Low25.44
Previous Weekly High25.36
Previous Weekly Low24.49
Previous Monthly High26.09
Previous Monthly Low23.57
Daily Fibonacci 38.2%25.83
Daily Fibonacci 61.8%25.68
Daily Pivot Point S125.64
Daily Pivot Point S225.23
Daily Pivot Point S325.01
Daily Pivot Point R126.26
Daily Pivot Point R226.47
Daily Pivot Point R326.88

Author

Christian Borjon Valencia

Christian Borjon began his career as a retail trader in 2010, mainly focused on technical analysis and strategies around it. He started as a swing trader, as he used to work in another industry unrelated to the financial markets.

More from Christian Borjon Valencia
Share:

Markets move fast. We move first.

Orange Juice Newsletter brings you expert driven insights - not headlines. Every day on your inbox.

By subscribing you agree to our Terms and conditions.

Editor's Picks

EUR/USD bounces toward 1.1750 as US Dollar loses strength

EUR/USD returned to the 1.1750 price zone in the American session on Friday, despite falling Wall Street, which indicates risk aversion. Trading conditions remain thin following the New Year holiday and ahead of the weekend, with the focus shifting to US employment and European data scheduled for next week.

GBP/USD nears 1.3500, holds within familiar levels

After testing 1.3400 on the last day of 2025, GBP/USD managed to stage a rebound. Nevertheless, the pair finds it difficult to gather momentum and trades with modest intraday gains at around 1.3490 as market participants remain in holiday mood.

Gold trims intraday gains, approaches $4,300

Gold retreated sharply from the $4,400  area and trades flat for the day in the $4,320 price zone. Choppy trading conditions exacerbated the intraday decline, although XAU/USD bearish case is out of the picture, considering growing expectations for a dovish Fed and persistent geopolitical tensions.

Cardano gains early New Year momentum, bulls target falling wedge breakout

Cardano kicks off the New Year on a positive note and is extending gains, trading above $0.36 at the time of writing on Friday. Improving on-chain and derivatives data point to growing bullish interest, while the technical outlook keeps an upside breakout in focus.

Economic outlook 2026-2027 in advanced countries: Solidity test

After a year marked by global economic resilience and ending on a note of optimism, 2026 looks promising and could be a year of solid economic performance. In our baseline scenario, we expect most of the supportive factors at work in 2025 to continue to play a role in 2026.

Crypto market outlook for 2026

Year 2025 was volatile, as crypto often is.  Among positive catalysts were favourable regulatory changes in the U.S., rise of Digital Asset Treasuries (DAT), adoption of AI and tokenization of Real-World-Assets (RWA).