|

Silver Price Analysis: XAG/USD prints slight gains yet remains below $23.00

  • Silver rises slightly to $22.99, supported by lower US Treasury yields and a weaker Dollar, boosting demand for precious metals.
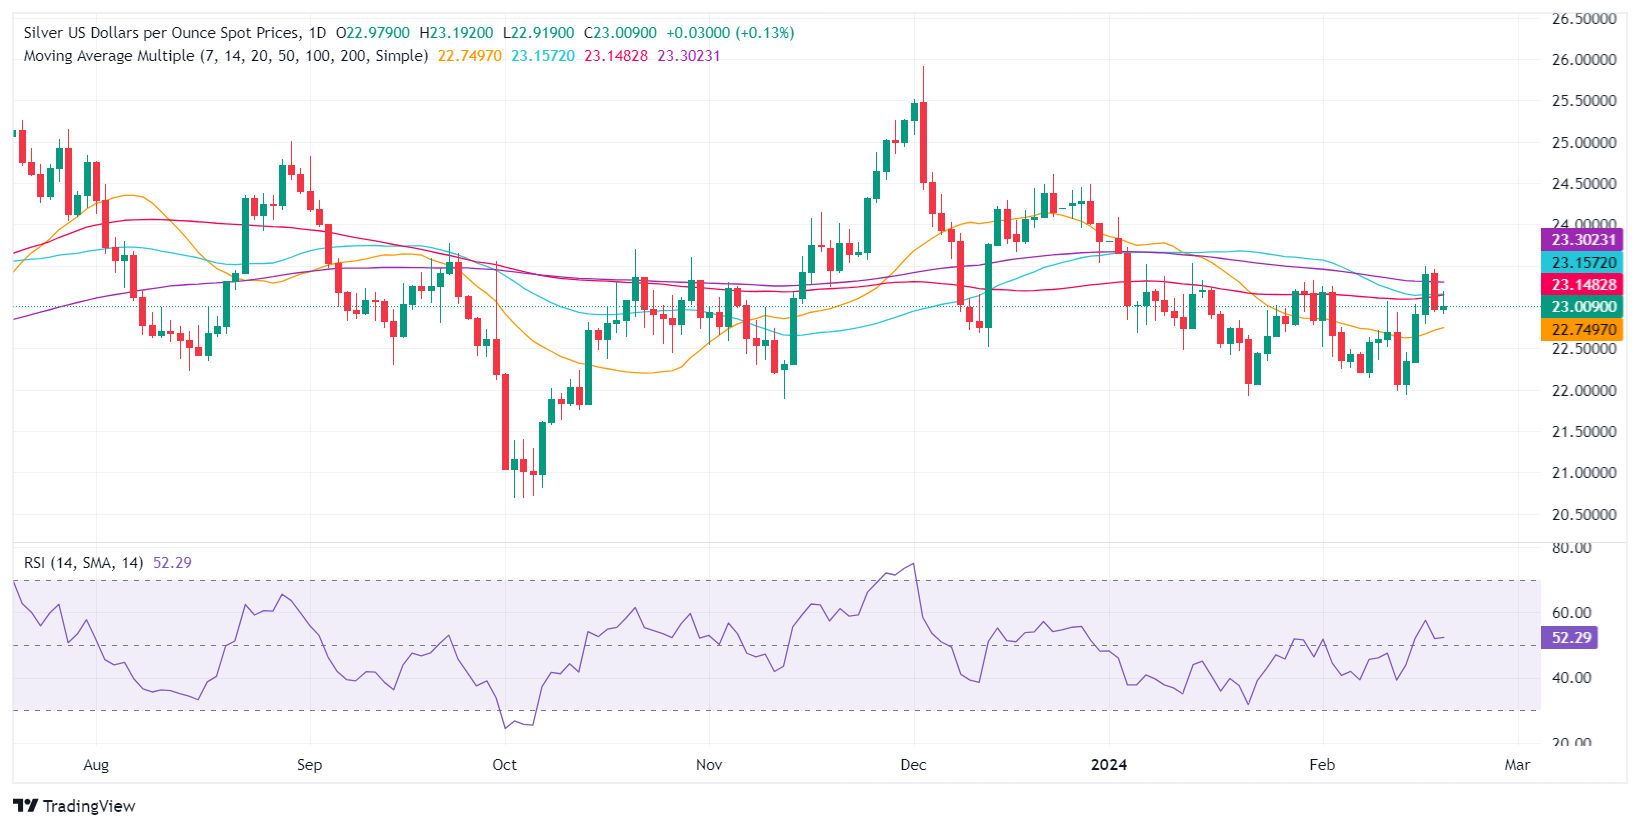
  • Facing technical resistance at $23.13-15, with the 200-DMA at $23.28 posing a major obstacle for further gains.
  • Downside risk if silver breaches $23, eyeing February's lows; success above immediate resistances critical for upward momentum.

Silver clings to minuscule gains late in the New York session on Tuesday, up 0.04%, and is trading at around $22.99 a troy ounce. Falling US Treasury bond yields and the Greenback are the main catalysts for the rise in precious metals, while technical resistance levels capped the XAG/USD upside.

XAG/USD rose briefly toward the confluence of the 50 and 100-day Moving Averages (DMAs) at around $23.13-15 during Tuesday’s session but failed to challenge the 200-DMA at $23.28. As a ‘dark cloud cover’ looms, bears dragged Silver’s price below $23.00, which could open the door to test the February 18 low of $22.80. A breach of the latter will accelerate the downtrend towards the February 15 low of $22.35, followed by the $22.00 figure.

Conversely, if buyers reclaim $23.15, that will open the door for further gains. The first resistance would be the 200-DMA at $23.28, followed by the current year-to-date (YTD) high at $24.09.

XAG/USD Price Action – Daily Chart

XAG/USD TECHNICAL LEVELS

Overview
Today last price23
Today Daily Change0.02
Today Daily Change %0.09
Today daily open22.98
 
Trends
Daily SMA2022.72
Daily SMA5023.15
Daily SMA10023.13
Daily SMA20023.31
 
Levels
Previous Daily High23.46
Previous Daily Low22.94
Previous Weekly High23.5
Previous Weekly Low21.93
Previous Monthly High24.09
Previous Monthly Low21.93
Daily Fibonacci 38.2%23.14
Daily Fibonacci 61.8%23.26
Daily Pivot Point S122.79
Daily Pivot Point S222.61
Daily Pivot Point S322.28
Daily Pivot Point R123.31
Daily Pivot Point R223.64
Daily Pivot Point R323.83

Author

Christian Borjon Valencia

Markets analyst, news editor, and trading instructor with over 14 years of experience across FX, commodities, US equity indices, and global macro markets.

More from Christian Borjon Valencia
Share:

Editor's Picks

AUD/USD eyes 0.7150 barrier nine-day EMA

AUD/USD inches higher after registering modest losses in the previous day, trading around 0.7130 during the Asian hours. The technical analysis of the daily chart indicates that the pair is moving sideways within the rectangle pattern, suggesting a consolidation as neither the bulls nor the bears have enough momentum to take control of the market.

USD/JPY trades below 160.00 intervention threshold; bullish bias intact

The USD/JPY pair attracts some sellers during the Asian session amid fears that authorities will step in again to prop up the Japanese Yen. Furthermore, the Israel-Lebanon truce prompts some profit-taking around the US Dollar and exerts downward pressure on the currency pair.

Gold defends 200-day SMA, rises toward $4,500

Gold is attempting a tepid recovery toward $4,500 on Thursday, as renewed optimism in the Mideast geopolitical front calms market nerves. This cautious optimism across Asian markets weighs on Oil prices, and diminishes the US Dollar’s safe-haven appeal, helping Gold stage a decent comeback from the weekly low of $4,424.


Hyperliquid: ETF demand, capital rotation fuel HYPE rally as Bitcoin melts

Hyperliquid price sustains an upward trend near its all-time high of $75.76 on Thursday after posting 80% gains in May, while Bitcoin (BTC) retraces below $65,000, triggering a market-wide panic.

Kevin Warsh takes the Fed helm: What it means for the US Dollar
The Federal Reserve moves away from the highly predictable "forward guidance" model of the Jerome Powell era to a new “Kevin Warsh environment”, characterized by less communication, more policy surprises, and an increased focus on the Fed's complex balance sheet.
Recession on paper: What really moves the Canadian Loonie now?

Statistics Canada handed the headline writers a gift and the analysts a headache. Real GDP shrank 0.1% on an annualized basis in the first quarter, and with the fourth quarter of 2025 revised down to a 1.0% contraction, that is two negative quarters in a row, the textbook definition of a technical recession and Canada's first since the pandemic.