Eurozone Retail Sales contract more-than-expected: What weak Retail Sales mean for EUR/USD

The Eurozone Retail Sales data for April declines at a faster pace of 0.4% in April, compared to the 0.3% contraction expected. In March, the Retail Sales data, a key measure of consumer spending, rose by 0.8%, revised sharply higher from 0.1% decline. On an annualized basis, the consumer spending measure grew by 1%, faster than 0.3% estimates, but slower than the previous reading of 2.1%, revised higher from 1.2%.
Though Eurozone monthly Retail Sales have contracted sharply, there has been a sharp upside move in the Euro (EUR) during the European trade. As of writing, EUR/USD trades 0.25% higher to near 1.1630. This could be the outcome of a ceasefire announcement between the US-Iran alliance army and Iran-backed Hezbollah in Lebanon.
Euro Price Today
The table below shows the percentage change of Euro (EUR) against listed major currencies today. Euro was the strongest against the Canadian Dollar.
| USD | EUR | GBP | JPY | CAD | AUD | NZD | CHF | |
|---|---|---|---|---|---|---|---|---|
| USD | -0.27% | -0.15% | -0.14% | 0.02% | -0.09% | -0.16% | -0.30% | |
| EUR | 0.27% | 0.12% | 0.15% | 0.29% | 0.17% | 0.02% | -0.03% | |
| GBP | 0.15% | -0.12% | 0.02% | 0.17% | 0.06% | -0.11% | -0.18% | |
| JPY | 0.14% | -0.15% | -0.02% | 0.15% | 0.04% | -0.13% | -0.18% | |
| CAD | -0.02% | -0.29% | -0.17% | -0.15% | -0.11% | -0.27% | -0.34% | |
| AUD | 0.09% | -0.17% | -0.06% | -0.04% | 0.11% | -0.14% | -0.20% | |
| NZD | 0.16% | -0.02% | 0.11% | 0.13% | 0.27% | 0.14% | -0.08% | |
| CHF | 0.30% | 0.03% | 0.18% | 0.18% | 0.34% | 0.20% | 0.08% |
The heat map shows percentage changes of major currencies against each other. The base currency is picked from the left column, while the quote currency is picked from the top row. For example, if you pick the Euro from the left column and move along the horizontal line to the US Dollar, the percentage change displayed in the box will represent EUR (base)/USD (quote).
What do weak Eurozone Retail Sales data mean for EUR/USD?
The Eurozone Retail Sales data reflects the households’ spending power of the old continent. Soft Retail Sales exhibit weakness in the overall demand and prompt the need for loose monetary conditions by the European Central Bank (ECB), a scenario that is unfavorable for the Euro (EUR).
However, market participants expect the ECB to tighten monetary conditions in the near term, in an attempt to counter rising inflationary pressures due to elevated oil prices.
Technical Analysis: EUR/USD trades inside Descending Triangle pattern
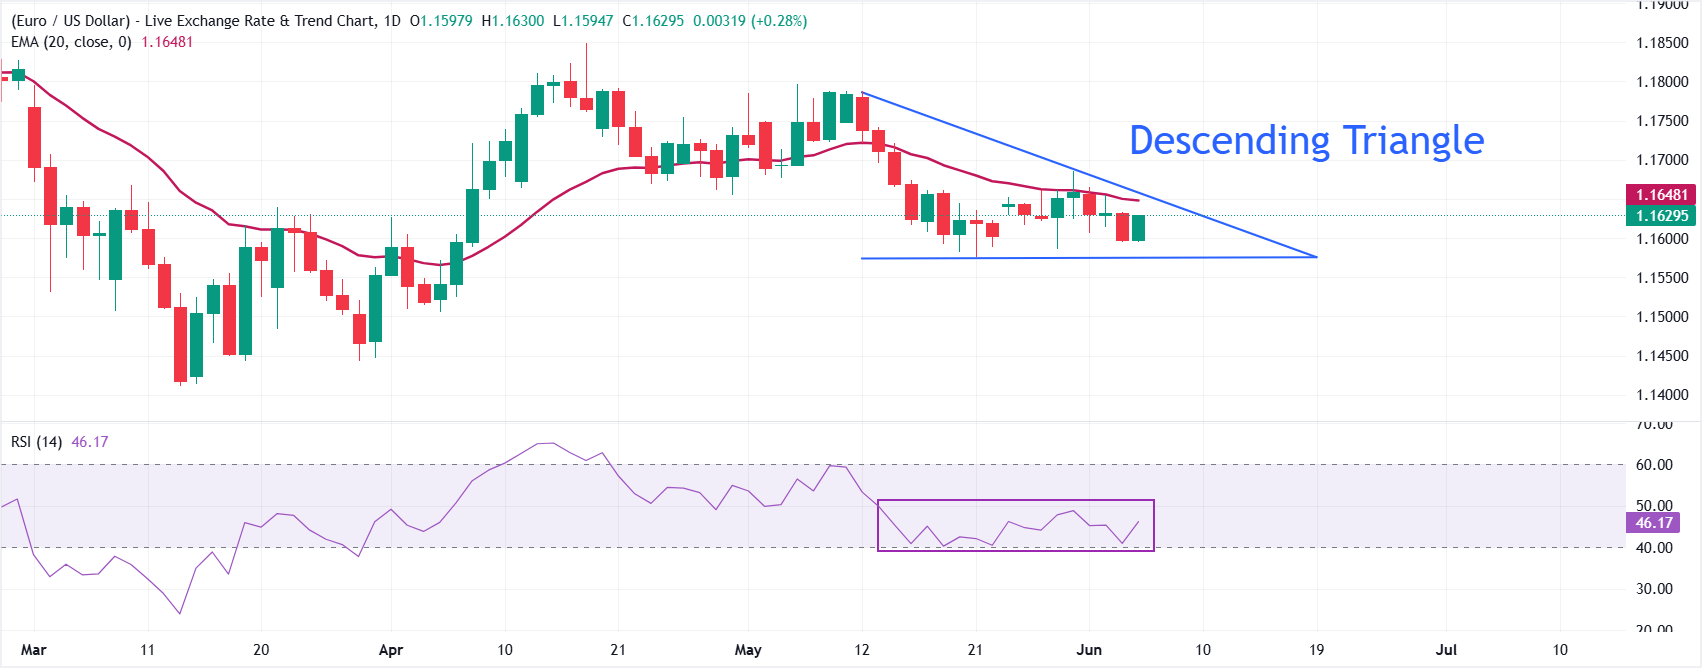
EUR/USD trades higher at around 1.1630 at press time. The pair keeps a mild bearish tone as it holds below the 20-period exponential moving average (EMA) at 1.1648.
The pair is consolidating inside the Descending Triangle pattern, and the Relative Strength Index (RSI) at around 46 hints at soft downside bias rather than outright selling pressure.
On the topside, immediate resistance is seen at the 20-day EMA at 1.1648, followed by the descending trend-line barrier near 1.1656, and a daily close above this cluster would be needed to ease the current downside pressure and extend the upside towards 1.1700. On the downside, initial support is provided by the rising trend line coming in around 1.1575, where a break would open the door to a deeper pullback towards 1.1500.
(The technical analysis of this story was written with the help of an AI tool.)
Economic Indicator
Retail Sales (MoM)
The Retail Sales data, released by Eurostat on a monthly basis, measures the volume of retail sales in the Eurozone. It shows the performance of the retail sector in the short term, which accounts for around 5% of the total value added of the Eurozone economies. Retail Sales data is widely followed as an indicator of consumer spending. Percent changes reflect the rate of changes in such sales, with the MoM reading comparing sales volumes in the reference month with the prior month. Generally, a high reading is seen as bullish for the Euro (EUR), while a low reading is seen as bearish
Read more.Last release: Thu Jun 04, 2026 09:00
Frequency: Monthly
Actual: -0.4%
Consensus: -0.3%
Previous: -0.1%
Source: Eurostat
Author

Sagar Dua
FXStreet
Sagar Dua is associated with the financial markets from his college days. Along with pursuing post-graduation in Commerce in 2014, he started his markets training with chart analysis.