Silver Price Analysis: XAG/USD plummets from 8-month highs to $22.20s
- Silver price plunges 3.74%, on high US Treasury yields, back below $22.30.
- Silver Price Analysis: A daily close below $22.24 would exacerbate a fall further; otherwise, a re-test of $23.00 is possible.

Silver price collapsed from around $23.51 daily high down to $22.23, spurred by high US Treasury yields caused by upbeat US economic data justifying the Federal Reserve’s (Fed) need to continue increasing borrowing costs. Therefore, the XAG/USD drops 3.90%, trading at $22.25.
Silver Price Analysis: XAG/USD Technical Outlook
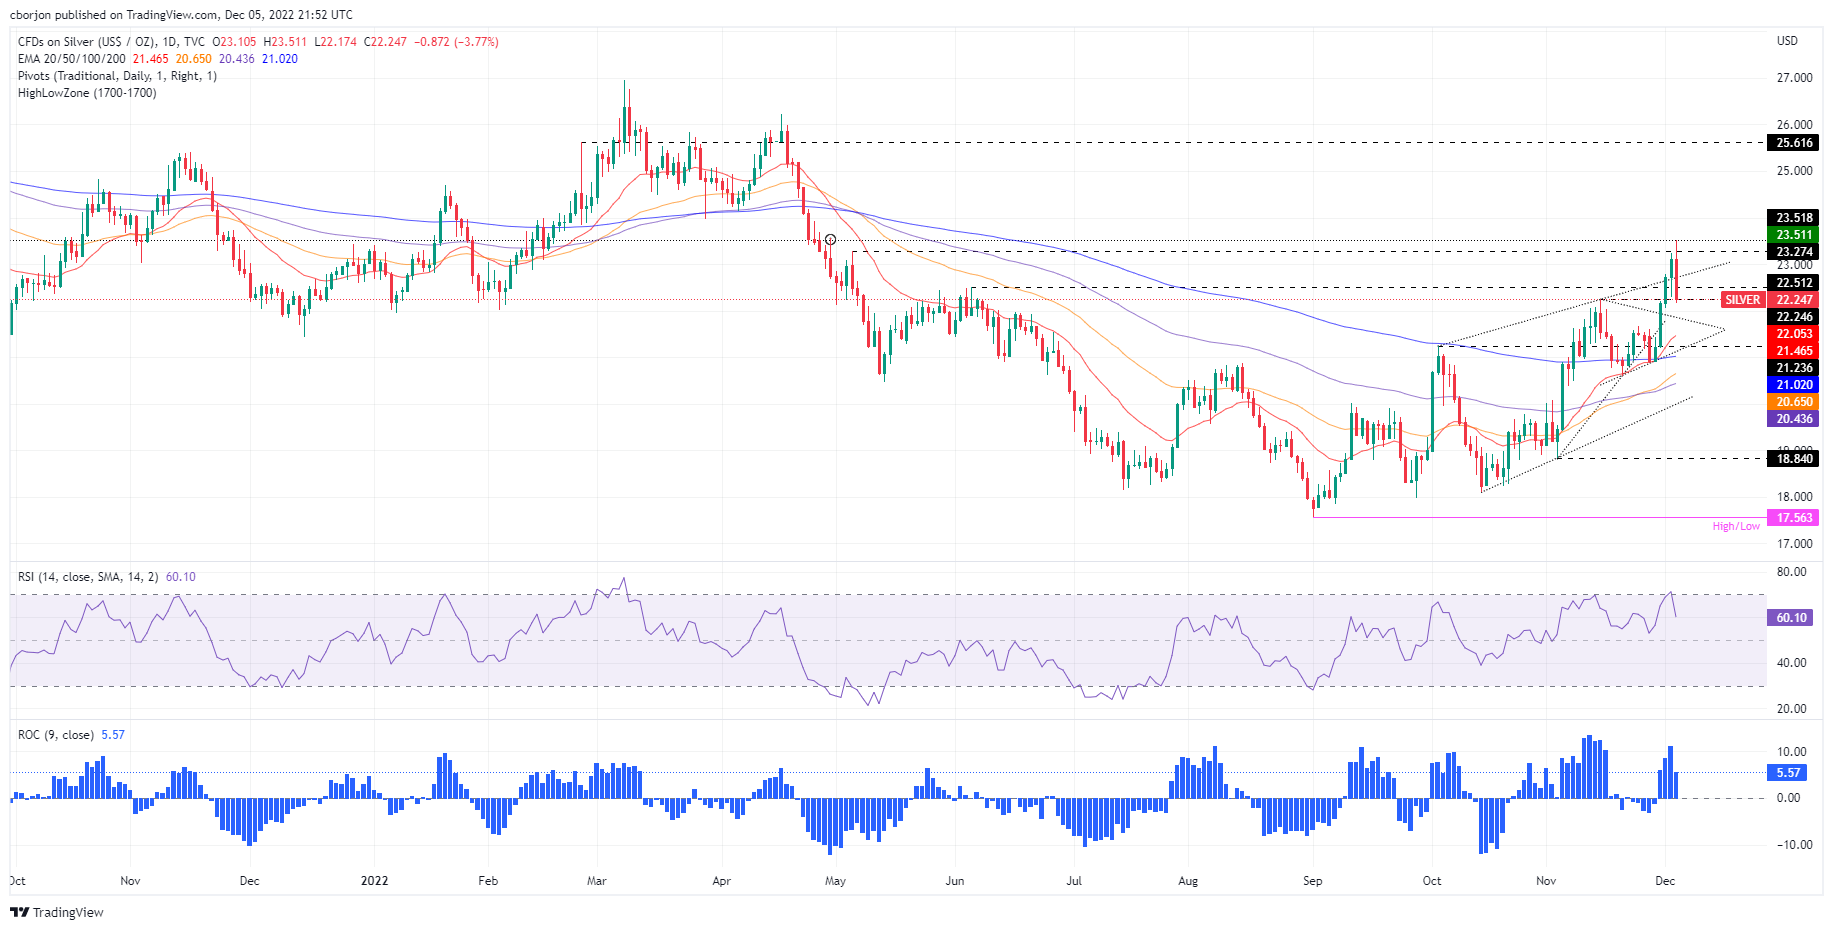
The XAG/USD daily chart portrays the white metal as upward biased, despite falling from multi-month highs. Should be noted that XAG/USD is testing the November 15 daily high of 22.24, which, once cleared, would exacerbate a deeper correction toward the $22.00 psychological mark, followed by the 200-day Exponential Moving Average (EMA) at $21.02.
The Relative Strength Index (RSI) exited from overbought conditions, triggering a sell signal that caused Monday’s dive, while the Rate of Change (RoC) depicts buyers losing momentum.
Therefore, the XAG/USD might be headed for a pullback. However, if XAG/USD holds its reins above $22.24, that could open the door for consolidation. Hence, the XAG/USD first resistance would be the $22.50 mark, followed by the $23.00 figure. Break above will expose the multi-month high of $23.50.
Silver Key Technical Levels
Author

Christian Borjon Valencia
FXStreet
Markets analyst, news editor, and trading instructor with over 14 years of experience across FX, commodities, US equity indices, and global macro markets.


