|

Silver Price Analysis: XAG/USD keeps smashing through the resistance zones

  • Silver is trading 6.69% higher as precious metals soar. 
  • The price smashed through the resistance area at USD 21.13 per ounce.

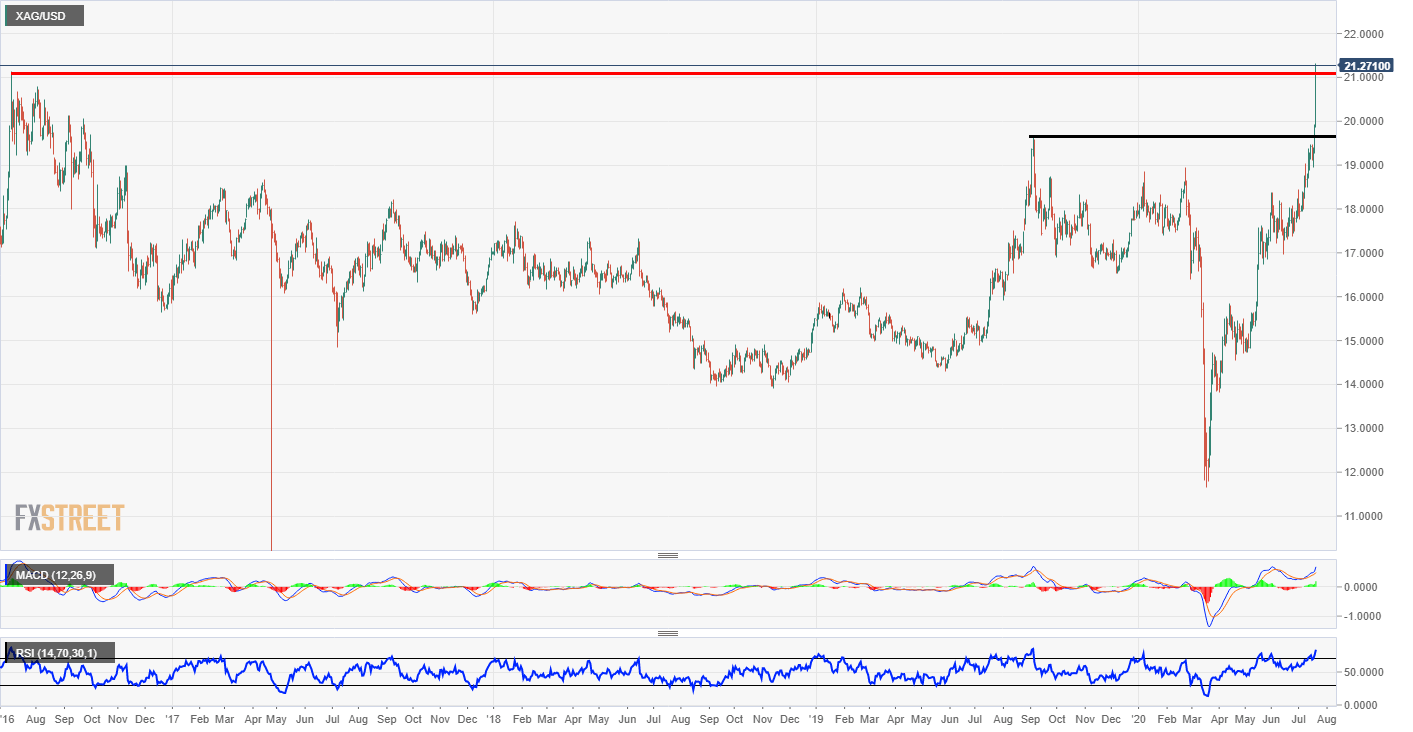
XAG/USD daily chart

The precious metals have been off the charts recently and silver has been the pick of the bunch. The push higher has seen the metal break yet another resistance zone and it now trades 6.69% higher on Tuesday. The bottom of the 2011 consolidation area is USD 26.11 and this could be the big target for the bulls. The all-time high is still some way off at USD 49.83 per ounce. 

Looking closer at the chart below, the price took the previous wave high of USD 19.65 per ounce. Just now the red resistance zone has been broken but we should wait for the daily close to see if the price can hold the break. The indicators are looking very bullish too. The MACD histogram is firmly green and the signal lines are about the mid-zone too. The Relative Strength Index is also in a very positive area above 70. It is looking slightly oversold but this can happen with the indicator. 
Silver soaring

XAG/USD monthly chart

The monthly chart really highlights the major levels. The black resistance zone at USD 26.17 per ounce looks very firm. The bulls look set to try and target that level and there could be some resistance. The Indicators are still positive very much like on the daily chart above but the Relative Strength Index has way more room on the monthly. 

Silver chart

Additional levels

XAG/USD

Overview
Today last price21.29
Today Daily Change1.38
Today Daily Change %6.93
Today daily open19.91
 
Trends
Daily SMA2018.49
Daily SMA5017.78
Daily SMA10016.4
Daily SMA20016.98
 
Levels
Previous Daily High19.92
Previous Daily Low19.26
Previous Weekly High19.48
Previous Weekly Low18.7
Previous Monthly High18.39
Previous Monthly Low16.95
Daily Fibonacci 38.2%19.67
Daily Fibonacci 61.8%19.51
Daily Pivot Point S119.47
Daily Pivot Point S219.03
Daily Pivot Point S318.8
Daily Pivot Point R120.13
Daily Pivot Point R220.36
Daily Pivot Point R320.8

Author

Rajan Dhall, MSTA

Rajan Dhall is an experienced market analyst, who has been trading professionally since 2007 managing various funds producing exceptional returns.


More from Rajan Dhall, MSTA
Share:

Editor's Picks

GBP/USD remains depressed below 1.3400 amid escalating US-Iran tensions

The GBP/USD pair finds some support near 1.3370 after a modest gap-down opening, though it lacks bullish conviction and remains below 1.3400. Nevertheless, spot prices, for now, seem to have stalled the pullback from a nearly four-week high, around the 1.3450 area, touched on Friday amid mixed fundamental cues.


EUR/USD: Flag breakdown supports more downside towards 1.1325

The Euro holds opening losses at around 1.1390 against the US Dollar during the mid-Asian trading session on Monday. The major currency pair faces selling pressure as the US Dollar starts the week on a strong note due to an increase in the appeal of safe-haven assets.

Gold seems vulnerable amid Iran risks reviving inflation fears, Fed hike bets

Gold maintains its offered tone through the Asian session, and currently trades just above $4,050, down nearly 1.40% for the day. A further escalation of tensions between the US and Iran, along with the closure of the Strait of Hormuz, lifts crude oil prices and revives inflation fears. This, in turn, bolsters expectations of higher interest rates by the US Federal Reserve, which benefits the safe-haven US Dollar, and drives flows away from the bullion.

Cardano: Ongoing whale accumulation fails to halt downward  correction

Cardano (ADA) extends its losses, trading below $$0.160 after falling over 14% in the previous week. Despite on-chain data showing continued accumulation by whales, the buying activity has failed to lift prices. Meanwhile, bearish derivatives metrics and a weakening technical outlook indicate further downside for ADA.

Week ahead – US CPI and Warsh testimony to take centre stage, BoC eyed too
It’s been more than a month since Kevin Warsh took over as head of the Federal Reserve but after one FOMC meeting and two public appearances later, investors are still trying to gauge where the new chair sits on the dove-hawk scale.
Five sessions, one round trip: Why the whipsaw is exactly what Warsh ordered

Markets opened July with a December hike as the base case and spent five trading sessions unlearning and relearning it. A 57K payrolls print bled the tightening bets out of the strip; a re-shut Strait of Hormuz is pushing them back in. Wednesday's minutes from the June FOMC meeting landed mid-round-trip, describing a world that had already stopped existing.