Silver Price Analysis: XAG/USD hovers around $23.30s, unable to break $23.50
- Silver price is trading sideways after hitting a daily high of $23.39.
- XAG/USD Price Analysis: Short term, the XAG/USD might test $24.00 once it reclaims $23.50: otherwise, it would consolidate.

Silver price consolidates for the fourth straight day after hitting a weekly high of $23.52. However, the white metal faces solid resistance and trades sideways on Wednesday. At the time of typing, the XAG/USD is trading at $23.32 for a gain of 0.40%.
XAG/USD Price action
On Wednesday, the XAG/USD failed to sustain the early break above March’s 28 high of $23.37, which would open the door to test the week’s low at $22.83 once sellers break the $23.00 psychological level. That would open the door for a leg down, and if the XAG/USD tumbles below the former, that could exacerbate a test of the 20-day Exponential Moving Average (EMA) at $22.32.
On the flip side, with Silver’s buyers cracking $23.50, upside risks would lie at $24.00, followed by a test of the YTD high at $24.63.
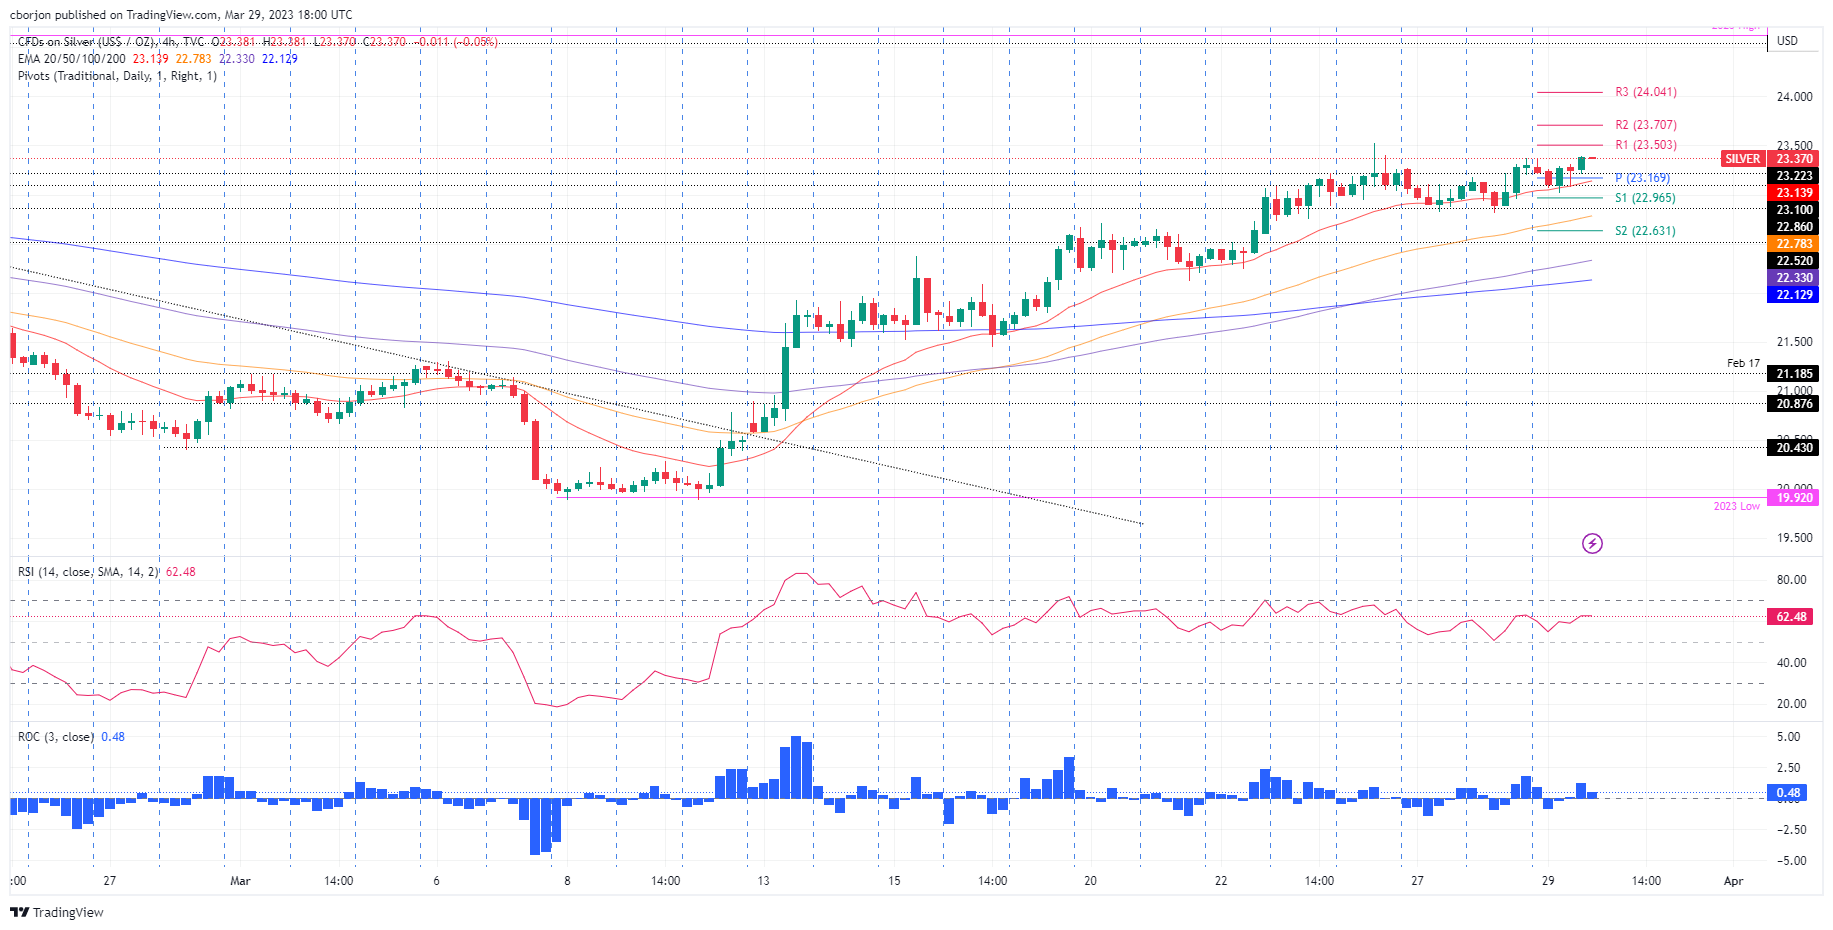
In the short term, the XAG/USD 4-hour chart portrays the white metal as neutral to upward bias, and it might test $23.50 soon. A breach of the latter will clear the path to test higher pivot points, like #2 at $23.70, before assaulting R3 at $24.04.
XAG/USD 4-hour chart
XAG/USD Technical levels
Author

Christian Borjon Valencia
FXStreet
Markets analyst, news editor, and trading instructor with over 14 years of experience across FX, commodities, US equity indices, and global macro markets.


