Silver Price Analysis: XAG/USD hits a four-week high but retreats as gravestone doji emerges


  • Silver price hits a four-week high at $24.52 but retraces to $24.26.
  • For bullish continuation, XAG/USD must breach $24.49 resistance, opening the path to $25.00 per troy ounce.
  • XAG/USD’s failure to crack $24.49 could lead to further losses, with potential dips to $24.01 and $23.63.

Silver price reaches a new four-week high but retraces from those levels to finish the day, forming a gravestone doji, suggesting neither buyers nor sellers win the battle, which would continue into the following week. Therefore, the XAG/USD finished the week trading at $24.26 after hitting a daily high of $24.52.

XAG/USD Price Analysis: Technical outlook

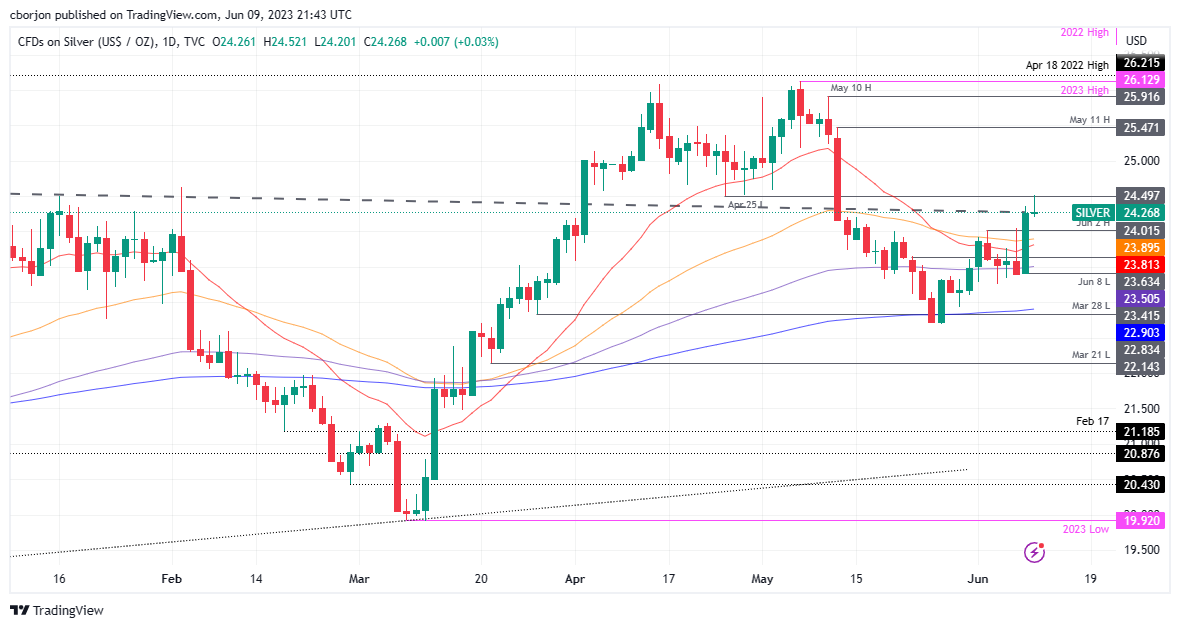
The XAG/USD daily chart portrays the pair as neutral-biased in the near term. Although the daily EMAs sit beneath Silver’s spot price, XAG/USD’s failure to break market structure above the April 25 low turned resistance at $24.49 would likely keep Silver’s price depressed. Nevertheless, real news like the Federal Reserve (Fed) monetary policy decision on Wednesday could give direction after printing a doji on the latest day of the week.

For a bullish continuation, XAG/USD must reclaim $24.49, which could put into play the $25.00 figure per troy ounce in play. A breach of the latter will expose the May 11 high at $25.47 before challenging May 10 daily high at $25.91.

XAG/USD’s failure to break $24.49 could pave the way for further losses. The XAG/USD could dive towards the June 2 daily high at $24.01, followed by the June 8 low at $23.63, ahead of dropping toward $23.50.

XAG/USD Price Action – Daily chart

XAG/USD Daily chart

XAG/USD

Overview
Today last price 24.29
Today Daily Change 0.02
Today Daily Change % 0.08
Today daily open 24.27
 
Trends
Daily SMA20 23.57
Daily SMA50 24.49
Daily SMA100 23.35
Daily SMA200 22.23
 
Levels
Previous Daily High 24.36
Previous Daily Low 23.43
Previous Weekly High 24.02
Previous Weekly Low 22.93
Previous Monthly High 26.14
Previous Monthly Low 22.68
Daily Fibonacci 38.2% 24
Daily Fibonacci 61.8% 23.79
Daily Pivot Point S1 23.68
Daily Pivot Point S2 23.09
Daily Pivot Point S3 22.76
Daily Pivot Point R1 24.61
Daily Pivot Point R2 24.94
Daily Pivot Point R3 25.53


Share: Feed news

Information on these pages contains forward-looking statements that involve risks and uncertainties. Markets and instruments profiled on this page are for informational purposes only and should not in any way come across as a recommendation to buy or sell in these assets. You should do your own thorough research before making any investment decisions. FXStreet does not in any way guarantee that this information is free from mistakes, errors, or material misstatements. It also does not guarantee that this information is of a timely nature. Investing in Open Markets involves a great deal of risk, including the loss of all or a portion of your investment, as well as emotional distress. All risks, losses and costs associated with investing, including total loss of principal, are your responsibility. The views and opinions expressed in this article are those of the authors and do not necessarily reflect the official policy or position of FXStreet nor its advertisers. The author will not be held responsible for information that is found at the end of links posted on this page.

If not otherwise explicitly mentioned in the body of the article, at the time of writing, the author has no position in any stock mentioned in this article and no business relationship with any company mentioned. The author has not received compensation for writing this article, other than from FXStreet.

FXStreet and the author do not provide personalized recommendations. The author makes no representations as to the accuracy, completeness, or suitability of this information. FXStreet and the author will not be liable for any errors, omissions or any losses, injuries or damages arising from this information and its display or use. Errors and omissions excepted.

The author and FXStreet are not registered investment advisors and nothing in this article is intended to be investment advice.

Recommended content


Recommended content

Editors’ Picks

EUR/USD bounces off lows, approaches 1.1550

EUR/USD bounces off lows, approaches 1.1550

EUR/USD continues to recover ground lost and now extends the rebound to the 1.1550 zone on Friday. Meanwhile, the US Dollar maintain its bullish bias intact in response to a significant flight to safety amid increasing geopolitical concerns, while positive consumer sentiment data also contribute to the daily uptick.

Gold keeps the trade above $3,400 on safe-haven demand

Gold keeps the trade above $3,400 on safe-haven demand

Gold prices maintain its upward trajectory on Friday, reaching its peak level since late April above the $3,400 mark per troy ounce. Furthermore, the precious metal draws increased safe-haven interest amid escalating tensions in the Middle East, triggered by Israel's military action against Iran.

GBP/USD trims losses, retargets 1.3600

GBP/USD trims losses, retargets 1.3600

After an earlier dip toward the 1.3520 area, GBP/USD has regained some composure, trading within sight of the key 1.3600 barrier as the week draws to a close. The pair remains under pressure on Friday, weighed down by renewed US Dollar strength amid rising risk aversion and a stronger-than-expected consumer confidence report.

Crypto Today: Bitcoin, Ethereum, XRP clamber for support amid escalating volatility on Israel-Iran tensions

Crypto Today: Bitcoin, Ethereum, XRP clamber for support amid escalating volatility on Israel-Iran tensions

The cryptocurrency market has been hit by a sudden wave of extreme volatility, triggering widespread declines as global markets react to tensions between Israel and Iran. Bitcoin is hovering at around $104,668 at the time of writing on Friday, following a reflex recovery from support tested at $102,513.

Week ahead – Markets brace for central bank barrage amid heightened uncertainty

Week ahead – Markets brace for central bank barrage amid heightened uncertainty

Fed officials to stand pat as they await further clarity. A dovish BoJ could push rate hike expectations into 2026. Deflation fuels speculation about negative SNB rates. BoE may sound more dovish after disappointing UK data.

The Best brokers to trade EUR/USD

The Best brokers to trade EUR/USD

SPONSORED Discover the top brokers for trading EUR/USD in 2025. Our list features brokers with competitive spreads, fast execution, and powerful platforms. Whether you're a beginner or an expert, find the right partner to navigate the dynamic Forex market.

Forex MAJORS

Cryptocurrencies

Signatures

Best Brokers of 2025