|

Silver Price Analysis: XAG/USD hit YTD high at $26.08 but retreated on a bearish-engulfing pattern

  • XAG/USD is poised for five consecutive weeks of gains, up 0.81%.
  • Silver’s break below $26.00 opened the door for a test of $25.00.

Silver price reached a new YTD high at $26.08, but retraces, as traders booking profits, are forming a bearish-engulfing candle pattern, suggesting that further downside is warranted. Among technical indicators, US economic news and Fed speakers underpinned the US Dollar (USD) to the detriment of the white metal. At the time of typing, the XAG/USD is trading at $25.23, down 2.26%.

XAG/USD Price Action

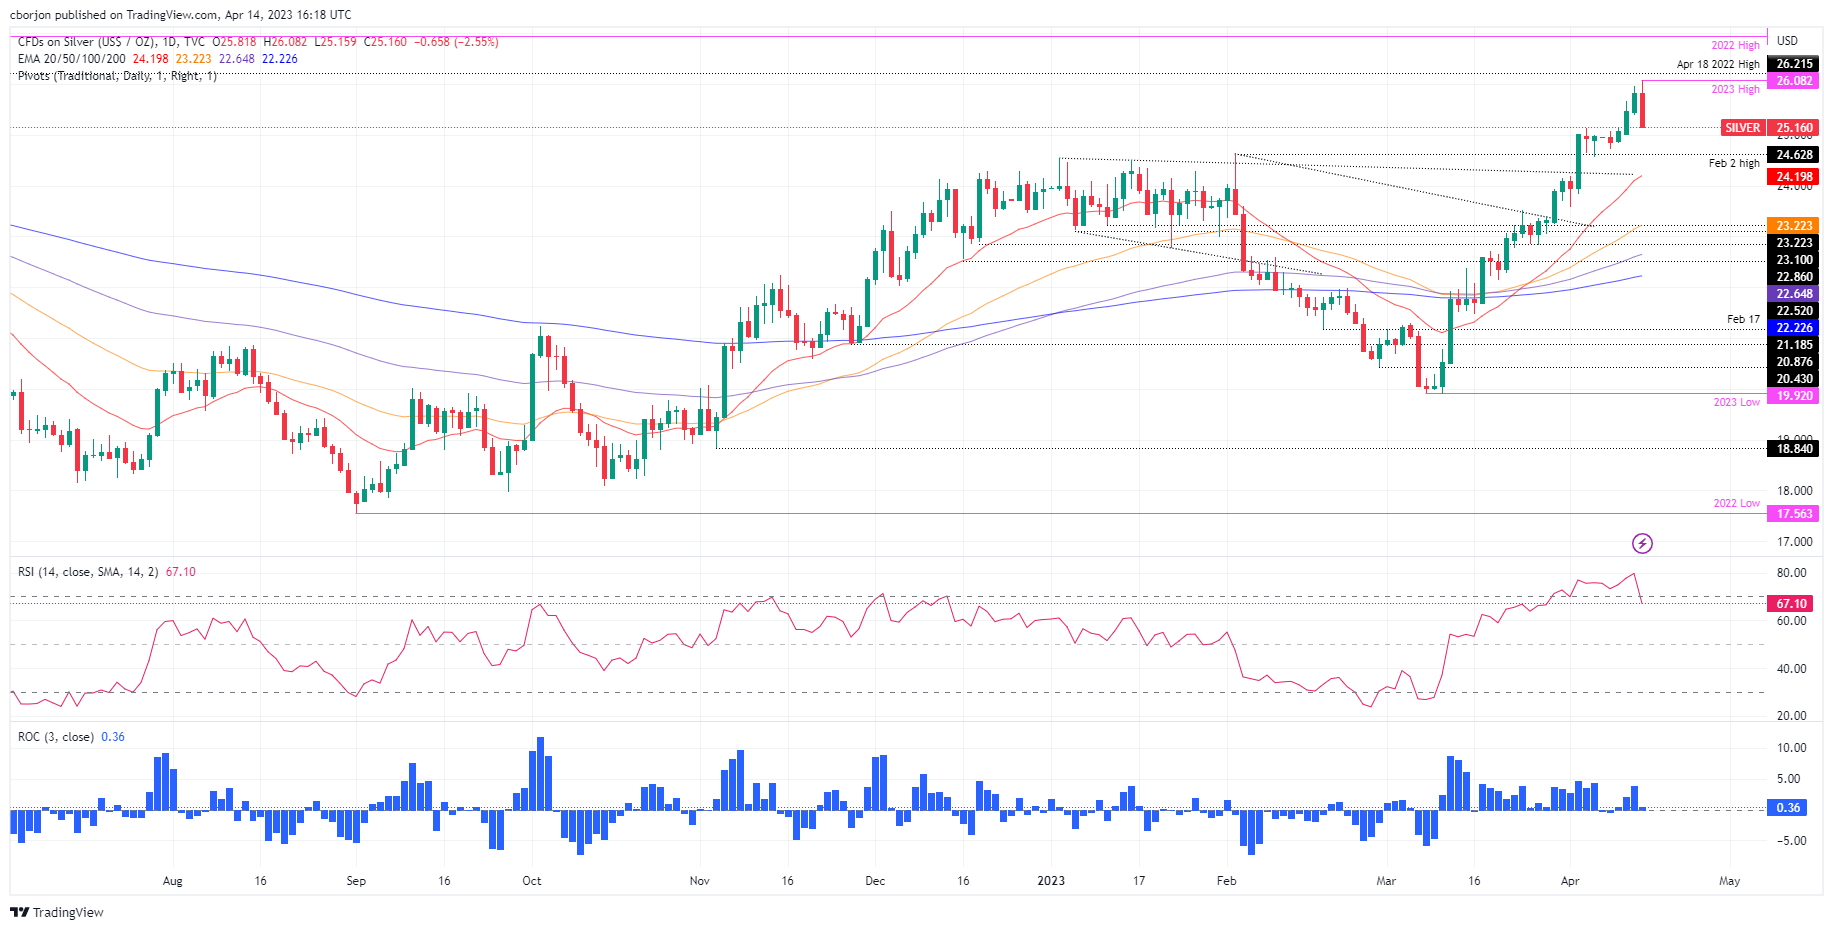
The XAG/USD is still upward biased from a daily chart perspective. The emergence of a bearish candlestick pattern and the Relative Strength Index (RSI) exiting oversold territory triggered profit-taking in the white metal. Additionally, a negative divergence between XAG/USD’s price action and the Rate of Change (RoC) indicates that buying pressure is waning, exacerbating Silver’s drop below $26.00.

If XAG/USD falls below $25.00, that will pave the way toward the February 2 high at $24.63, the previous resistance turned support, followed by the 20-day Exponential Moving Average (EMA) at $24.20. Once cleared, the psychological $24.00 level would be next.

Conversely, for a bullish continuation, the XAG/USD needs to get above the April 13 low of $25.40, which could motivate XAG buyers to re-enter the market at solid price levels. In that case, the XAG/USD first resistance would be the YTD high at $26.08, followed by April 18, 2022, swing high at $26.21, followed by 2022 high at $26.94.

XAG/USD Daily Chart

XAG/USD Daily Chart

XAG/USD Technical Levels


Overview
Today last price25.16
Today Daily Change-0.66
Today Daily Change %-2.56
Today daily open25.82
 
Trends
Daily SMA2023.82
Daily SMA5022.41
Daily SMA10022.89
Daily SMA20021.23
 
Levels
Previous Daily High25.98
Previous Daily Low25.39
Previous Weekly High25.14
Previous Weekly Low23.57
Previous Monthly High24.16
Previous Monthly Low19.9
Daily Fibonacci 38.2%25.75
Daily Fibonacci 61.8%25.61
Daily Pivot Point S125.49
Daily Pivot Point S225.15
Daily Pivot Point S324.9
Daily Pivot Point R126.07
Daily Pivot Point R226.31
Daily Pivot Point R326.65

Author

Christian Borjon Valencia

Markets analyst, news editor, and trading instructor with over 14 years of experience across FX, commodities, US equity indices, and global macro markets.

More from Christian Borjon Valencia
Share:

Editor's Picks

EUR/USD flirts with weekly lows near 1.1770

EUR/USD now comes under further selling pressure, breaking below the 1.1800 support to challenge the area of weekly throughs near 1.1770 on Thursday. The pair’s decline comes in response to marked gains in the US Dollar amid steady geopolitical tensions. Ealier in the day, the ECB’s Lagarde delivered cautious remarks, although the currency remained apathetic.

GBP/USD threatens the 200-day SMA near 1.3440

GBP/USD rapidly leaves behind Wednesday’s strong advance, coming under heavy pressure and retesting the 1.3440 zone, where the critical 200-day SMA is located. Cable’s deep pullback follows the strong gains in the Greenback, while investors continue to pencil in a potential BoE rate cut in March.

Gold trims gains, slips back to around $5,170

Gold is now facing some downside pressure, hovering around the $5,170 region on Thursday. The yellow metal surrenders part of its earlier gains on the back of the resurgence of the buying interest in the Greenback. In the meantime, geopolitical tensions in the Middle East continue to limit the downside potential for now.

Stellar: Relief bounce fades as bearish undertone persists

Stellar is trading around $0.16 at the time of writing on Thursday after rebounding more than 8% in the previous day. Derivatives data paints a negative picture as XLM’s short bets hit a monthly high while Open Interest continues to decline.

Changing the game: International implications of recent tariff developments

The Supreme Court ruling on International Emergency Economic Powers Act (IEEPA) tariffs provides limited relief for the rest of the world, with weighted average tariff rates modestly lower.

Bitcoin steadies as traders eye US–Iran talks

Bitcoin (BTC) price is stabilizing around $68,000 at the time of writing on Thursday after a 6.2% relief rally the previous day amid a broader downward trend.