|

Silver Price Analysis: XAG/USD hangs near one-week low, just above $19.50 support

  • Silver extends its recent retracement slide from a multi-week high touched last Tuesday.
  • A convincing break below the $19.50 support should pave the way for additional losses.
  • A sustained strength beyond the $20.40 region is needed to negate any bearish outlook.

Silver remains under some selling pressure on Monday and extends last week's pullback from the $21.25 area or the highest level since late June. The white metal maintains its offered tone through the early part of the European session and drops to a one-week low, around the $19.70-$19.65 region in the last hour.

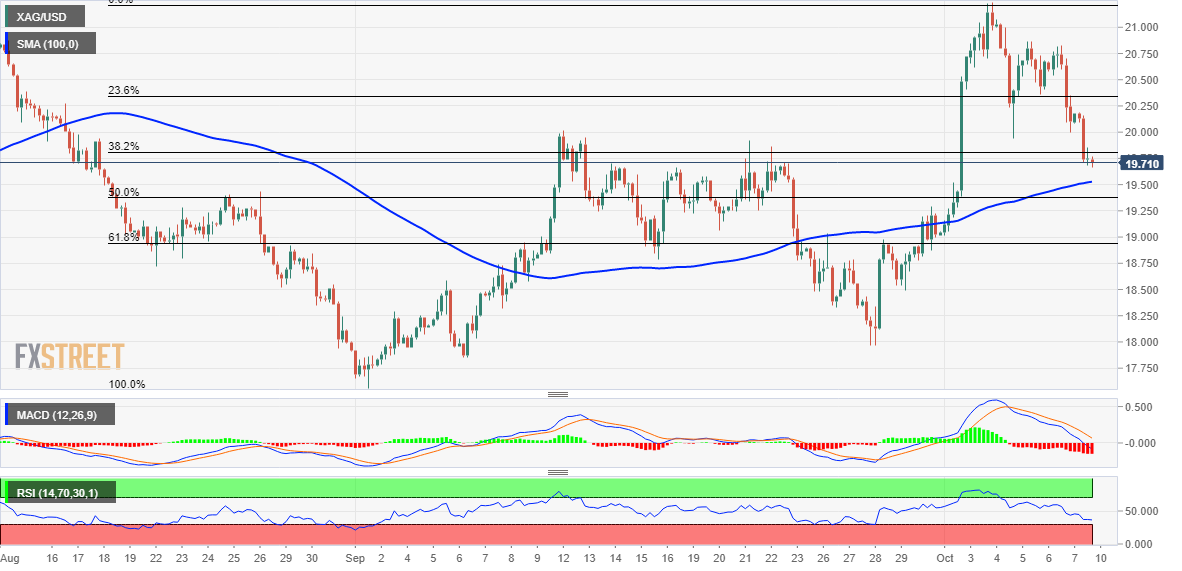
The XAG/USD is currently placed just below the 38.2% Fibonacci retracement level of the recent recovery from the YTD low, though has managed to hold above the 100-period SMA on the 4-hour chart. The latter, currently around the mid-$19.00s should now act as a key pivotal point. A sustained break below will be seen as a fresh trigger for bearish traders and pave the way for additional losses.

The subsequent downfall has the potential to drag the XAG/USD towards the 61.8% Fibo. level, around the $19.20 region. This is closely followed by the $19.00 mark, which if broken decisively will suggest that the corrective bounce has run out of steam and pave the way for additional losses. Spot prices could then accelerate the fall towards the $18.60 intermediate support en route to the $18.35 region and the $18.00 round figure.

On the flip side, the $20.00 psychological mark, coincides with the 38.2% Fibo. level, now seems to keep a lid on any intraday move-up. Any subsequent move up could attract some sellers and remain capped near the 23.6% Fibo. level, around the $20.40 region. Sustained strength beyond will negate any near-term negative bias and lift the XAG/USD to the $20.80-$20.85 area en route to the $21.00 mark and the monthly high, around the $21.25 region.

Silver 4-hour chart

fxsoriginal

Key levels to watch

XAG/USD

Overview
Today last price19.71
Today Daily Change-0.47
Today Daily Change %-2.33
Today daily open20.18
 
Trends
Daily SMA2019.56
Daily SMA5019.44
Daily SMA10020
Daily SMA20021.9
 
Levels
Previous Daily High20.83
Previous Daily Low20
Previous Weekly High21.24
Previous Weekly Low19.01
Previous Monthly High20.02
Previous Monthly Low17.56
Daily Fibonacci 38.2%20.32
Daily Fibonacci 61.8%20.51
Daily Pivot Point S119.84
Daily Pivot Point S219.51
Daily Pivot Point S319.01
Daily Pivot Point R120.67
Daily Pivot Point R221.16
Daily Pivot Point R321.5

Author

Haresh Menghani

Haresh Menghani is a detail-oriented professional with 10+ years of extensive experience in analysing the global financial markets.

More from Haresh Menghani
Share:

Editor's Picks

EUR/USD holds above 1.1750 after mixed EU PMI data

EUR/USD manages to hold above 1.1750 but struggles to gather recovery momentum on Friday, following the mixed February PMI figures from Germany and the Eurozone. In the second half of the day, Q4 GDP, December inflation and February PMI data from the US will be watched closely by market participants.

GBP/USD recovers further toward 1.3500 after UK PMI data

GBP/USD is recovering ground further toward 1.3500 in European trading on Friday, helped by a modest uptick in the Pound Sterling after stronger-than-expected UK January Retail Sales and February PMI data. However, the pair's further upside could be limited amid persistent US Dollar strength as the focus turns to key US data. 

Gold sticks to positive bias above $5,000 ahead of US data

Gold gains some positive traction for the third consecutive day on Friday. holding above $5,000. Traders now look forward to the key US macro releases – the Advance Q4 GDP report and the Personal Consumption Expenditures (PCE) Price Index – for fresh trading impetus. 

US GDP growth expected to slow down significantly in Q4 after stellar Q3 

The United States Bureau of Economic Analysis will publish the first preliminary estimate of the fourth-quarter Gross Domestic Product at 13:30 GMT. Analysts forecast the US economy to have expanded at a 3% annualized rate, slowing down from the 4.4% growth posted in the previous quarter.

Iran tensions and AI fears at the forefront ahead of key US data

Thursday’s scorecard shows major US Stock benchmarks closed modestly in the red amid mounting US-Iran tensions and AI disruption worries. The S&P 500 shed 19 points (0.3%) to 6,861, the Nasdaq 100 lost 101 points (0.4%) to 24,797, and the Dow Jones Industrial Average dropped 267 points (0.5%) to 49,395.

Official Trump price approaches breakout with mixed signals from traders

Official Trump (TRUMP) is trading at $3.50 at the time of writing, approaching its upper consolidation range. A breakout from this range could open the door for an upside move. On-chain data shows market indecision, with balanced flows between bulls and bears, signaling a lack of clear directional bias.