|

Silver Price Analysis: XAG/USD glimmers amid falling US bond yields, hovers around $22.70s

  • Silver price edges up 0.07% on Friday, buoyed by a dip in US Treasury bond yields and a mixed market sentiment.
  • Technicals suggest XAG/USD’s struggle near the weekly highs of $23.00, with the 200-day DMA acting as a key barrier.
  • Immediate resistance lies at the downslope trendline, with potential targets at $22.80 and pivotal $23.00 per ounce.

Silver price recovers some bright towards the end of the week, climbing 0.07% on Friday, underpinned by US Treasury bond yields falling, while the Greenback trims its weekly gains. Mixed sentiment surrounding the financial markets was another reason for the non-yielding metal to climb in the session, The XAG/USD is trading at $22.74 after hitting a daily low of $22.64.

XAG/USD Price Analysis: Technical outlook

Although XAG/USD would finish the week with gains, price action offered sellers a better entry price on Thursday, particularly for traders entering nearby the weekly highs of $23.00. Buyers’ failure to extend its gains, and reclaim the 200-day Moving Average (DMA) at $23.29, keeps the white metal exposed to selling pressure.

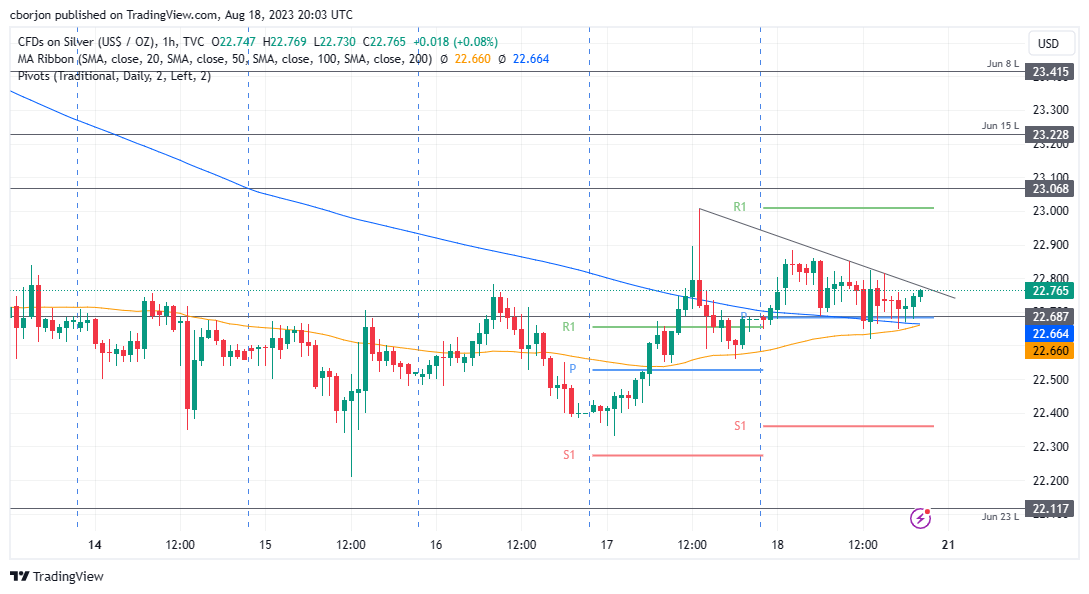
From an intraday perspective, the XAG/USD remains trading sideways, slightly tilted upwards, with upside risks remaining, as XAG/USD is testing a downslope resistance trendline. A breach of the latter will expose the $22.80 price level, followed by the confluence of the weekly high and Friday’s R1 daily pivot at around $23.00 per ounce.

A decisive break would expose the June 15 daily low turned resistance at $23.22, ahead of testing the June 8 low at $23.42.

XAG/USD Price Action – Hourly chart

XAG/USD

Overview
Today last price22.76
Today Daily Change0.08
Today Daily Change %0.35
Today daily open22.68
 
Trends
Daily SMA2023.56
Daily SMA5023.56
Daily SMA10024.03
Daily SMA20023.29
 
Levels
Previous Daily High23.01
Previous Daily Low22.35
Previous Weekly High23.68
Previous Weekly Low22.58
Previous Monthly High25.27
Previous Monthly Low22.52
Daily Fibonacci 38.2%22.76
Daily Fibonacci 61.8%22.61
Daily Pivot Point S122.35
Daily Pivot Point S222.02
Daily Pivot Point S321.69
Daily Pivot Point R123.01
Daily Pivot Point R223.34
Daily Pivot Point R323.67
 

Author

Christian Borjon Valencia

Christian Borjon began his career as a retail trader in 2010, mainly focused on technical analysis and strategies around it. He started as a swing trader, as he used to work in another industry unrelated to the financial markets.

More from Christian Borjon Valencia
Share:

Markets move fast. We move first.

Orange Juice Newsletter brings you expert driven insights - not headlines. Every day on your inbox.

By subscribing you agree to our Terms and conditions.

Editor's Picks

EUR/USD falls to near 1.1700 due to safe-haven demand

EUR/USD extends its losses, trading around 1.1710 during the Asian hours on Monday. The pair loses ground as the US Dollar strengthens on safe-haven demand, driven by a renewed rise in geopolitical risks following the United States’ capture of Venezuelan President Nicolas Maduro.

GBP/USD trades with modest losses below mid-1.3400s as geopolitical tensions lift USD

The GBP/USD pair opens with a modest bearish gap at the start of a new week and trades just below mid-1.3400s during the Asian session, down 0.10% for the day. Spot prices, however, lack follow-through selling and manage to hold above last week's swing low amid mixed fundamental cues.

Gold jumps over 1.5% to near $4,400 on US-Venezuela tensions

Gold holds sizeable gains near $4,400 in the Asian trading hours on Monday. The traditional safe-haven metal capitalizes on escalating geopolitical risks after the United States' capture of Venezuelan President Nicolas Maduro. Traders will closely monitor developments surrounding the US seizure of Maduro and await the US ISM Manufacturing Purchasing Managers' Index data later on Monday. 

Powerful guide to ISM, building permits, NFP and Silver technicals

Next week is important for U.S. markets. We get key economic data that can move stocks, bonds, and the dollar. The main reports are ISM Manufacturing, ISM Services, Building Permits, and Non-Farm Payrolls. Traders will watch these closely.

Economic outlook 2026-2027 in advanced countries: Solidity test

After a year marked by global economic resilience and ending on a note of optimism, 2026 looks promising and could be a year of solid economic performance. In our baseline scenario, we expect most of the supportive factors at work in 2025 to continue to play a role in 2026.

Crypto market outlook for 2026

Year 2025 was volatile, as crypto often is.  Among positive catalysts were favourable regulatory changes in the U.S., rise of Digital Asset Treasuries (DAT), adoption of AI and tokenization of Real-World-Assets (RWA).