|

Silver Price Analysis: XAG/USD flirts with 23.6% Fibo., bears await break below $24.50-40 support

  • Silver extends the overnight sharp fall and drifts lower for the second successive day on Tuesday.
  • The mixed technical setup warrants caution before positioning for any further depreciating move.
  • A sustained weakness below the $24.50-40 area is needed to support prospects for deeper losses.

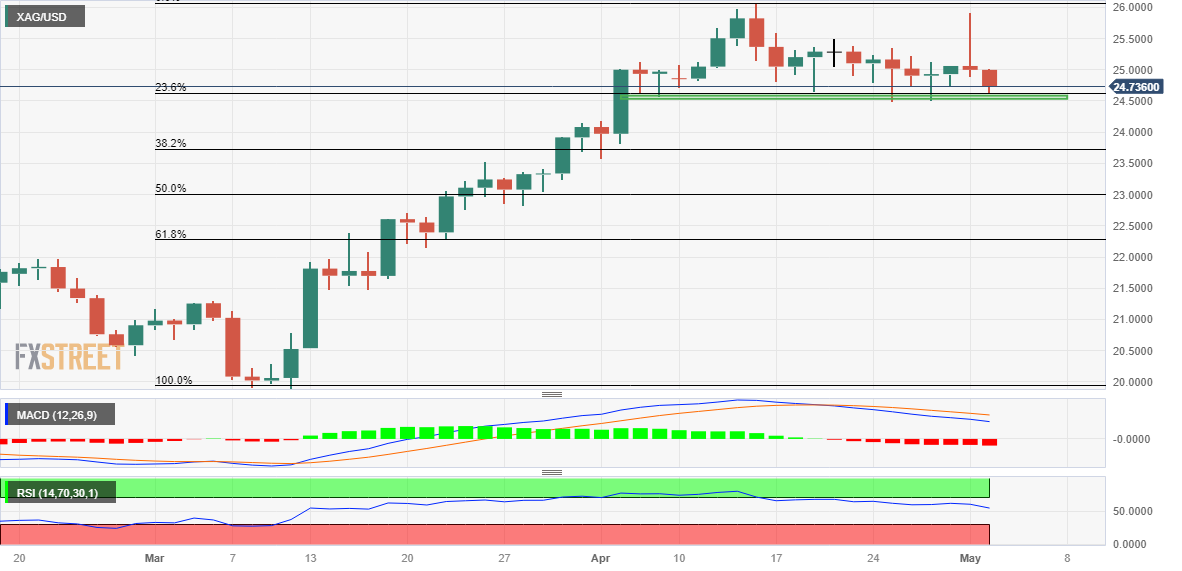
Silver extends the previous day's sharp retracement slide from the vicinity of the $26.00 mark and remains under heavy selling pressure for the second successive day on Tuesday. The steady intraday descent extends through the first half of the European session and drags the white metal back closer to the $25.50-$25.40 strong horizontal resistance breakpoint, now turned support.

The said area coincides with the 23.6% Fibonacci retracement level of the March-April rally, which if broken decisively will be seen as a fresh trigger for bearish traders and pave the way for deeper losses. The XAG/USD might then turn vulnerable to weaken further below the $24.00 mark and aim to test 38.2% Fibo. level, around the $23.70 area. The corrective decline could get extended further towards the $23.35-$23.30 horizontal support en route to the $23.00 confluence, comprising the 50% Fibo. level and the 50-day Simple Moving Average (SMA).

Oscillators on the daily chart, meanwhile, are still holding in the positive territory and support prospects for the emergence of some dip-buying at lower levels. That said, any intraday move up might now confront resistance near the $25.00 psychological mark. Some follow-through buying has the potential to lift the XAG/USD towards the $25.50 supply zone, above which bulls could attempt to conquer the $26.00 mark. The next relevant hurdle is pegged near the $26.25-$26.30 area, which if cleared will expose the 2022 high, just ahead of the $27.00 mark.

Silver daily chart

fxsoriginal

Key levels to watch

XAG/USD

Overview
Today last price24.72
Today Daily Change-0.28
Today Daily Change %-1.12
Today daily open25
 
Trends
Daily SMA2025.08
Daily SMA5023.14
Daily SMA10023.24
Daily SMA20021.6
 
Levels
Previous Daily High25.92
Previous Daily Low24.88
Previous Weekly High25.36
Previous Weekly Low24.49
Previous Monthly High26.09
Previous Monthly Low23.57
Daily Fibonacci 38.2%25.28
Daily Fibonacci 61.8%25.52
Daily Pivot Point S124.62
Daily Pivot Point S224.24
Daily Pivot Point S323.59
Daily Pivot Point R125.65
Daily Pivot Point R226.3
Daily Pivot Point R326.68

Author

Haresh Menghani

Haresh Menghani is a detail-oriented professional with 10+ years of extensive experience in analysing the global financial markets.

More from Haresh Menghani
Share:

Editor's Picks

GBP/USD resumes downside below 1.3200

GBP/USD resumes its downside below 1.3200 in European trading on Wednesday. The pair remains vulnerable amid a broadly firmer US Dollar and chaotic UK political environment. The focus is now on BoE-speak for further trading impetus.

EUR/USD sits at yearly low near 1.1350 on USD strength

EUR/USD sits at yearly lows near 1.1350 in the European morning on Wednesday. The pair remains vulnerable to further declines amid a bullish US Dollar. The Greenback continues to draw support from hawkish Fed bets and US-Iran peace deal uncertainty.

Gold: Bears retain control as Fed rate hike bets continue to boost USD

Gold recovers slightly from a nearly two-week low, around the $4,050 region, touched earlier this Wednesday. The commodity, however, sticks to its bearish bias for the second straight day, and seems vulnerable to weaken further amid sustained US Dollar buying.

Dogecoin tests a key make-or-break point amid waning retail support

Dogecoin trades below $0.08000 maintaining a steady decline for the seventh straight week. The meme coin is losing its retail strength as DOGE futures Open Interest drops 10% in 24 hours, while institutional demand remains muted with zero inflows so far this week.

Tech rout weighs on US stocks as the USD clocks a fresh 2026 high

Major US equity benchmarks ended Tuesday’s session considerably in the red, with the Nasdaq 100 down 3.3%, the S&P 500 off by 1.4%, and the Dow Jones down 0.1%. Stocks were largely weighed down by tech amid doubts over the AI-driven rally; the Philadelphia Semiconductor Index slid nearly 8%.

Regime change: Inside Kevin Warsh's first move to make the Fed unreadable on purpose

The rate did not move. That was the least interesting thing about Kevin Warsh's first meeting in charge of the Fed. The FOMC held its benchmark at 3.50%-3.75% for the fourth straight meeting, exactly as priced, and then the new chair used his first press conference to dismantle the machinery the market has leaned on for a decade.