|

Silver Price Analysis: XAG/USD falls but is subdued around $19.10, ahead of FOMC’s decision

  • Silver price tumbles ahead of the Fed November meeting on a buoyant US Dollar.
  • From a daily chart perspective, XAG/USD remains neutral-to-downward biased.
  • Short term, the XAG/USD is subdued around $19.10s.

XAG/USD slides from around the daily high at $19.25 towards the 50-day Exponential Moving Average (EMA) at $19.09 amidst broad US Dollar strength, exacerbated by US Treasury yields rising on an almost certain 75 bps Federal Reserve hike at November’s meeting. At the time of writing, XAG/USD is trading at $19.13, below its opening price by 0.40%.

XAG/USD Price Forecast: Technical outlook

From a daily chart perspective, XAG/USD remains neutral-to-downward biased, though it was neutral when the white metal reached a monthly high at $21.23. However,  erased its gains, and at the time of typing, it meanders around $19.10s. Worth noting that on its way south, the white metal tumbled below the 100 and the 20-day EMAs, so as mentioned above, the bias remains unchanged.

The Relative Strength Index (RSI) crossed below the 50-midline, meaning sellers are gathering momentum. Nevertheless, XAG/USD needs to achieve a daily close below $19.00, to open the door for further losses.

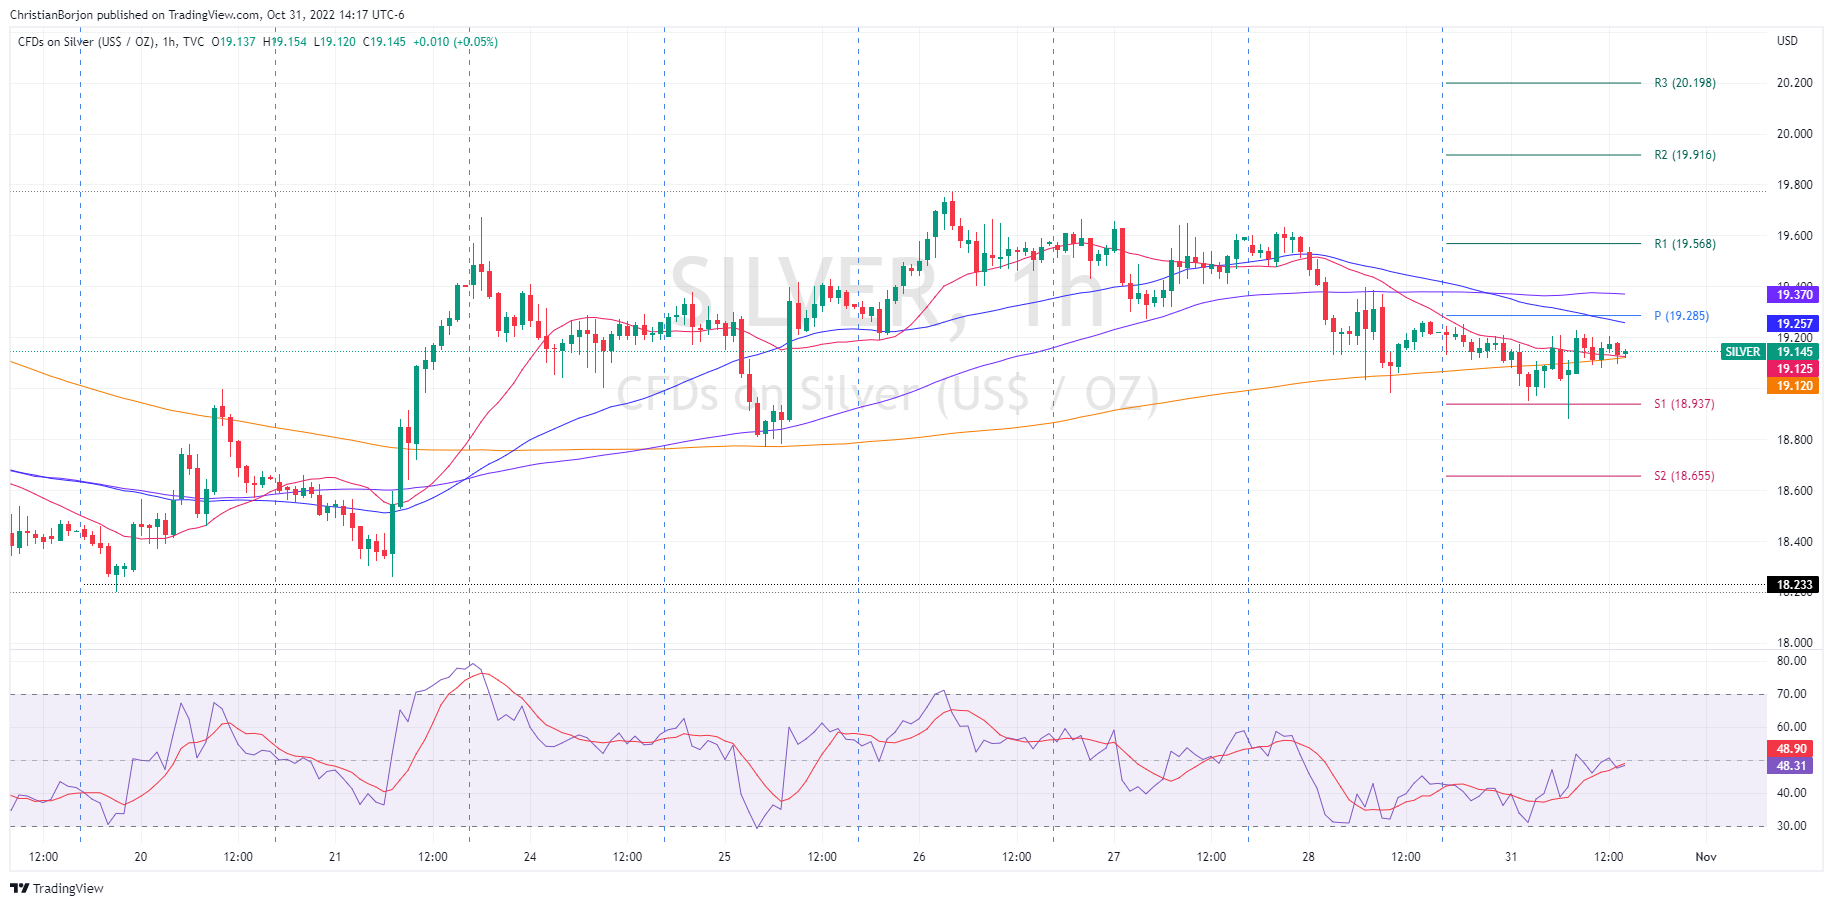
Short term, the XAG/USD is range-bound. However, traders should be aware that the Exponential Moving Averages (EMAs) remain below the spot price except for the 50 and 100-EMA, hovering around the daily pivot point at $19.25 and $19.37, respectively. Also, the Relative Strength Index (RSI) below the 50-midline is trendless, meaning that silver is consolidated.

Key resistance levels lie at the 50-EMA at $19.25, followed by the daily pivot level at $19.28, ahead of the 100-EMA at $19.37. On the flip side, the XAG/USD first support would be the confluence of the 20 and 200-EMA at $19.12, followed by the S1 daily pivot at $18.93, followed by the S2 pivot level at $18.65.
Key Technical Levels

XAG/USD

Overview
Today last price19.14
Today Daily Change-0.11
Today Daily Change %-0.57
Today daily open19.25
 
Trends
Daily SMA2019.46
Daily SMA5019.11
Daily SMA10019.56
Daily SMA20021.6
 
Levels
Previous Daily High19.64
Previous Daily Low19
Previous Weekly High19.78
Previous Weekly Low18.79
Previous Monthly High20.02
Previous Monthly Low17.56
Daily Fibonacci 38.2%19.24
Daily Fibonacci 61.8%19.39
Daily Pivot Point S118.95
Daily Pivot Point S218.66
Daily Pivot Point S318.31
Daily Pivot Point R119.59
Daily Pivot Point R219.94
Daily Pivot Point R320.23

Author

Christian Borjon Valencia

Markets analyst, news editor, and trading instructor with over 14 years of experience across FX, commodities, US equity indices, and global macro markets.


More from Christian Borjon Valencia
Share:

Editor's Picks

AUD/USD stays defensive below 0.7150 after Chinese data

AUD/USD remains on the back foot below 0.7150 in the Asian session on Tuesday, close to an over three-week low touched the previous day. US bond yields hold near multi-year highs ahead of the FOMC meeting and oil-driven inflation risks, supporting the US Dollar and weighing on the currency pair. Mixed Chinese activity data for August also fail to inspire the Aussie.

USD/JPY extends gains toward 155.00 amid USD resurgence

USD/JPY keeps pushing higher toward 155.00 early Tuesday, looking for more upside, as traders await the FOMC and BoJ meetings this week. Meanwhile, Fed rate-hike bets and oil-driven inflation risks keep US bond yields near multi-year highs, supporting the US Dollar and the pair. That said, a more hawkish repricing of the BoJ normalization path might continue to underpin the Japanese Yen and could limit USD/JPY's upside. .

$4,275: Gold skating on thin ice as eyes remain on Mideast conflict, Fed

Gold is briefly regaining $4,300 early Tuesday, looking to build on a tepid recovery from six-week troughs near $4,250. Traders are monitoring the widening conflict in the Middle East ahead of the two-day US Federal Reserve monetary policy meeting later in the day.

Bitcoin remains volatile amid CLARITY Act vote – Zcash, Stellar rally

Bitcoin holds steady around $78,000 on Tuesday, sustaining its roughly 2% recovery from the previous day. Broader cryptocurrency market volatility remains elevated ahead of the scheduled CLARITY Act cloture vote on Tuesday. Zcash and Stellar retain bullish momentum, emerging as the top performers over the last 24 hours.

Hard assets are entering their next explosive phase – Are you positioned?
It’s official: Commodities and Hard Assets have become the best-performing asset class of 2026. In a year defined by persistent inflation, geopolitical conflict, rising sovereign debt and intensifying supply disruption, capital is rotating aggressively into the one area governments cannot print and central banks cannot manufacture: scarce physical assets.
Venezuela’s 65-billion-barrel Oil deal could reshape America’s inflation fight
The United States (US) has secured unprecedented access to part of Venezuela’s vast Oil reserves. The timing is particularly significant as the war with Iran is disrupting Middle Eastern supplies, keeping energy prices elevated and reviving concerns about inflation.















