|

Silver Price Analysis: XAG/USD faces the 200-DMA at around $21.70s

  • XAG/USD advances as US Treasury bond yields undermine the US Dollar.
  • The XAG/USD is testing the confluence of the 50/100/200-day EMAs.
  • XAG/USD Price Analysis: To remain upwards in the short term, though the rally’s size suggests a mean reversion correction.

XAG/USD surges sharply in Monday’s session, up by more than 6% on investors flying to safety. US Treasury bond yields collapsed due to regional bank failure in the United States (US) blamed on higher rates. Therefore, US bond yields collapsing are a tailwind for the white metal prices. At the time of writing, the XAG/USD is trading at $21.76.

XAG/USD Price Action

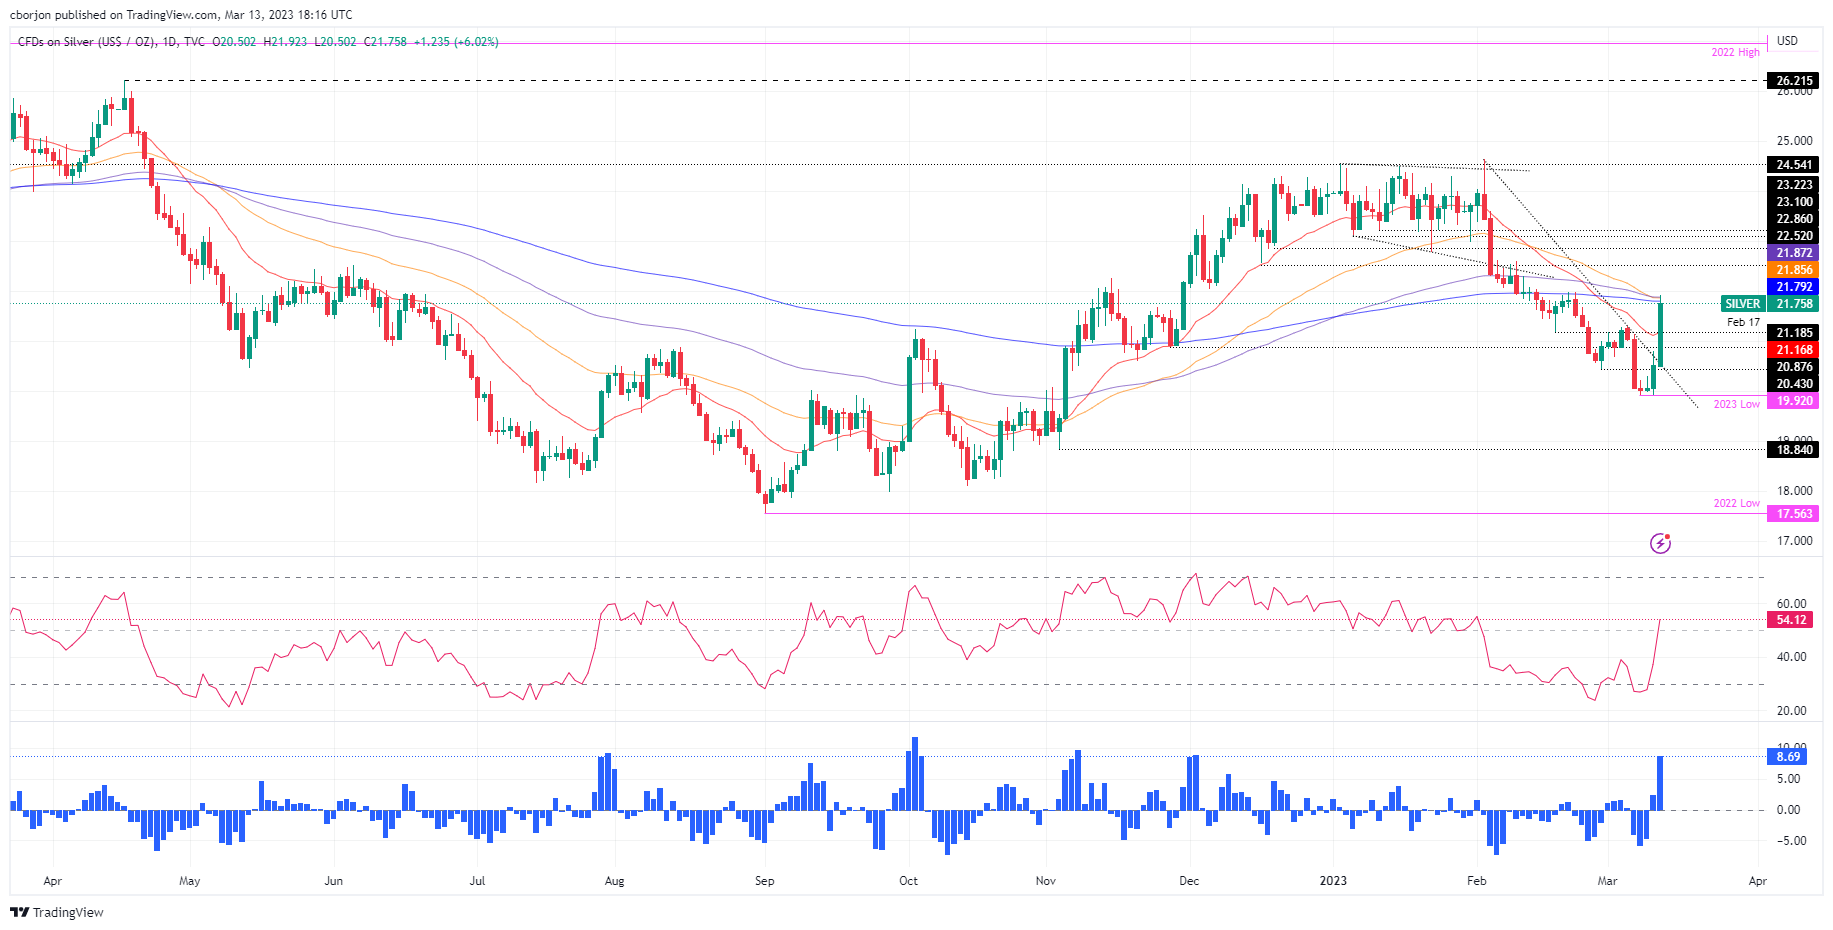
The white metal is testing solid resistance in the confluence of the 200, 50, and 100-day Exponential Moving Averages (EMAs), each at $21.79, $21.85, and $21.87, respectively. In addition, the Relative Strength Index (RSI) broke above the 50 neutral lines, portraying buying pressure strength. The Rate of Change (RoC) suggests buyers moved aggressively, which could open the door for a mean reversion move. Therefore, traders should be careful.

With XAG/USD breaking above the 200-day EMA would pave the way toward $22.00 a troy ounce. Once done, the XAG/USD next resistance would be $23.00 before testing the February 23 high at $23.59.

In an alternate scenario, the XAG/USD first support would be the 20-day EMA at $21.16. A breach of the latter will expose the $21.00 figure, followed by the March 13 low of $20.50, before falling to YTD lows at $19.92.

XAG/USD Daily Chart

XAG/USD Technical Levels

XAG/USD

Overview
Today last price21.78
Today Daily Change1.25
Today Daily Change %6.09
Today daily open20.53
 
Trends
Daily SMA2021.13
Daily SMA5022.52
Daily SMA10022.2
Daily SMA20020.94
 
Levels
Previous Daily High20.79
Previous Daily Low19.9
Previous Weekly High21.31
Previous Weekly Low19.9
Previous Monthly High24.64
Previous Monthly Low20.42
Daily Fibonacci 38.2%20.45
Daily Fibonacci 61.8%20.24
Daily Pivot Point S120.02
Daily Pivot Point S219.52
Daily Pivot Point S319.13
Daily Pivot Point R120.91
Daily Pivot Point R221.3
Daily Pivot Point R321.81

Author

Christian Borjon Valencia

Markets analyst, news editor, and trading instructor with over 14 years of experience across FX, commodities, US equity indices, and global macro markets.

More from Christian Borjon Valencia
Share:

Editor's Picks

AUD/USD eyes 0.7150 barrier nine-day EMA

AUD/USD inches higher after registering modest losses in the previous day, trading around 0.7130 during the Asian hours. The technical analysis of the daily chart indicates that the pair is moving sideways within the rectangle pattern, suggesting a consolidation as neither the bulls nor the bears have enough momentum to take control of the market.

USD/JPY trades below 160.00 intervention threshold; bullish bias intact

The USD/JPY pair attracts some sellers during the Asian session amid fears that authorities will step in again to prop up the Japanese Yen. Furthermore, the Israel-Lebanon truce prompts some profit-taking around the US Dollar and exerts downward pressure on the currency pair.

Gold defends 200-day SMA at $4,425, but for how long?

Gold is attempting a tepid recovery toward $4,500 early Thursday, as renewed optimism in the Mideast geopolitical front calms market nerves. This cautious optimism across Asian markets weighs on Oil prices, and diminishes the US Dollar’s safe-haven appeal, helping Gold stage a decent comeback from the weekly low of $4,424.


Hyperliquid: ETF demand, capital rotation fuel HYPE rally as Bitcoin melts

Hyperliquid price sustains an upward trend near its all-time high of $75.76 on Thursday after posting 80% gains in May, while Bitcoin (BTC) retraces below $65,000, triggering a market-wide panic.

Kevin Warsh takes the Fed helm: What it means for the US Dollar
The Federal Reserve moves away from the highly predictable "forward guidance" model of the Jerome Powell era to a new “Kevin Warsh environment”, characterized by less communication, more policy surprises, and an increased focus on the Fed's complex balance sheet.
Recession on paper: What really moves the Canadian Loonie now?

Statistics Canada handed the headline writers a gift and the analysts a headache. Real GDP shrank 0.1% on an annualized basis in the first quarter, and with the fourth quarter of 2025 revised down to a 1.0% contraction, that is two negative quarters in a row, the textbook definition of a technical recession and Canada's first since the pandemic.