|

Silver Price Analysis: XAG/USD eyes 2020 highs at $29.86 amid lack of healthy resistance levels – Confluence Detector

With retail attention back on the whilte metal, Silver (XAG/USD) is trading near the highest levels in six months reached at $29.01 in early Asia. A surge in silver’s demand in physical markets, courtesy of the spillover of the Reddit-driven short squeeze, is the main catalyst behind the ongoing rally in the prices.

Silver has gained nearly 12.50% over the past four trading sessions due to the retail-trade frenzy. The metal looks to retest the 2020 highs at $29.86, as industry experts believe that the physical silver stock is almost over.

How is silver positioned on the technical graphs?

Silver Price Chart: Key resistances and supports

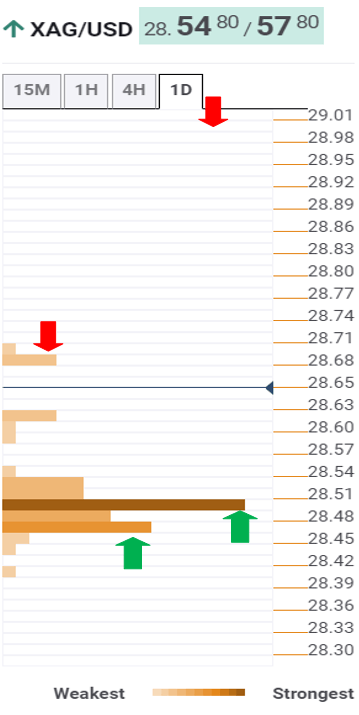
The Technical Confluences Indicator shows that the path of least resistance appears to the north amid a lack of healthy resistance levels.

The XAG bulls are battling the $28.60 hurdle, which the Bollinger Band one-hour Upper, above which six-month highs at $29.01 could be retested.

Buyers would then target seven-year tops at $29.86 en route $30 threshold.

Any pullbacks could meet strong demand around $28.45, which is the convergence of the pivot point one-month R1 and pivot point one-day R2.

The next relevant downside target is seen at the $28 round figure. Further south, the intraday low of $26.98.

Here is how it looks on the tool

About Confluence Detector

The TCI (Technical Confluences Indicator) is a tool to locate and point out those price levels where there is a congestion of indicators, moving averages, Fibonacci levels, Pivot Points, etc. Knowing where these congestion points are located is very useful for the trader, and can be used as a basis for different strategies.

Author

Dhwani Mehta

Dhwani Mehta

FXStreet

Residing in Mumbai (India), Dhwani is a Senior Analyst and Manager of the Asian session at FXStreet. She has over 10 years of experience in analyzing and covering the global financial markets, with specialization in Forex and commodities markets.

More from Dhwani Mehta
Share:

Editor's Picks

EUR/USD embarks on a consolidative move around 1.1600

EUR/USD rapidly leaves behind Friday’s small downtick and trades with solid gains on Monday, consolidating its daily advance around the 1.1600 region as the NA session draws to a close. Meanwhile, the improved risk appetite following the US-Iran deal and the reopening of the Strait of Hormuz continues to weigh on the US Dollar, lending support to the broader risk-linked galaxy.

GBP/USD retreats from tops, back to 1.3420

GBP/USD keeps its advance past the 1.3400 yardstick at the beginning of the week. In the meantime, Cable continues to draw support from improved market sentiment following reports that the US and Iran have reached a framework agreement aimed at ending the conflict and reopening the Strait of Hormuz.

Gold stays firm, still below $4,400

Gold builds on its recent gains on Monday, climbing well north of the $4,300 mark per troy ounce. The yellow metal benefits from renewed selling pressure on the Greenback as investors reassess the implications of the US-Iran agreement to end hostilities and reopen the Strait of Hormuz. Market participants now turn their attention to Wednesday's FOMC gathering.


Ethereum Price Forecast: BitMine continues accumulation as ETH climbs above $1,800
Ethereum (ETH) treasury firm BitMine Immersion Technologies (BMNR) expanded its holdings last week, purchasing 76,881 ETH amid weakness in the crypto market. The acquisition lifted BitMine's stash of the top altcoin to 5.62 million ETH worth $10.35 billion at the time of writing. The company claims it now holds 4.66% of ETH's circulating supply, bringing it closer to its alchemy of 5% goal.
Indonesia may have stabilised the Rupiah, but the bigger fight is not over

Bank Indonesia’s emergency rate hike has bought the Rupiah some time, but the currency’s hesitant response suggests it has not yet restored confidence. Can higher interest rates solve the Rupiah’s problem, or do the country’s challenges run deeper?

4.2% headline, 0.2% core: Why the Fed's next hike may be targeting the wrong problem

May's CPI put headline inflation at 4.2% on the year, up from 3.8% in April and the hottest reading since April 2023, while core prices rose just 0.2% on the month, undershooting the 0.3% consensus and halving April's pace.