|

Silver Price Analysis: XAG/USD eases from three-day tops, holds above 100-hour SMA

  • Silver gained positive traction for the second consecutive session on Wednesday.
  • Sustained move beyond the $22.65-70 confluence paved the way for further gains.
  • Bearish oscillators on the daily chart warrant caution for aggressive bullish traders.

Silver gained traction for the second successive day and recovered further from the lowest level since November 2020, around the $22.00 mark touched on Monday. The metal climbed to three-day tops, around the $22.90 region during the first half of the trading action on Wednesday, though lacked bullish conviction.

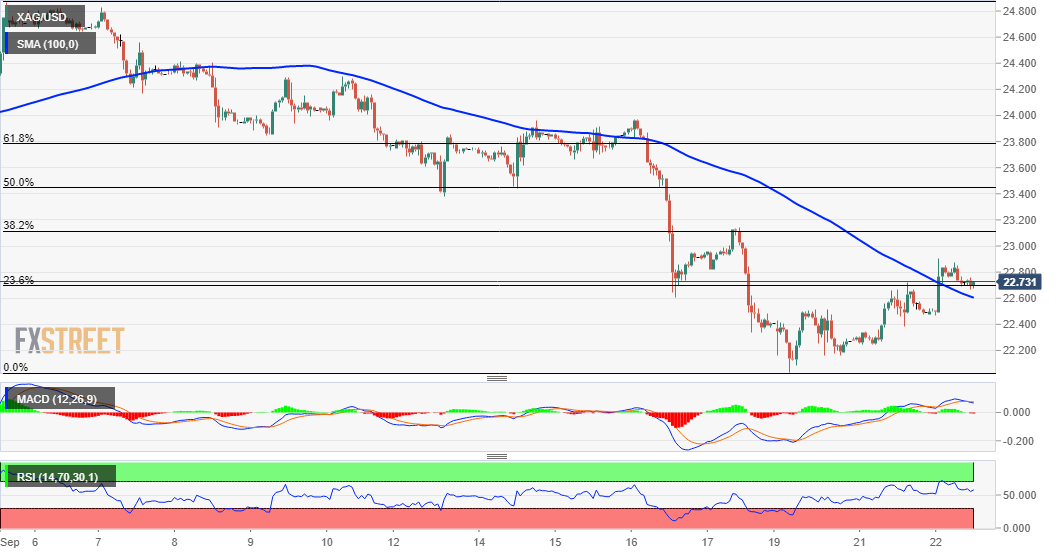
Looking at the technical picture, the momentum pushed the XAG/USD through the $22.65-70 confluence hurdle, comprising of 100-hour SMA and the 23.6% Fibonacci level of the $24.87-$22.04 recent leg down. However, the intraday pullback from the vicinity of the $23.00 mark warrants caution for aggressive bullish traders.

Meanwhile, technical indicators on the daily chart are holding deep in the negative territory and have been losing positive traction on the 1-hourly chart. The set-up seems tilted in favour of bearish traders, which further makes it prudent to wait for some follow-through buying before positioning for any further gains.

From current levels, the $22.50 area could protect the immediate downside ahead of the overnight swing lows, around the $22.25-20 region. This is followed by the $22.00 round-figure mark (YTD lows), which if broken decisively will be seen as a fresh trigger for bearish traders and turn the XAG/USD vulnerable to slide further.

The next relevant support is pegged near September 2020 lows, around the $21.65 region, before the XAG/USD eventually drops to challenge the $21.00 mark for the first time since July 2020.

On the flip side, momentum beyond the $22.90 area is likely to confront stiff resistance near the 38.2% Fibo. level, around the $23.10 region. A sustained strength beyond might trigger a short-covering move and lift the XAG/USD towards the 50% Fibo., around the $23.45-50 region, en-route the $23.80-85 supply zone (61.8% Fibo.).

Silver 1-hour chart

fxsoriginal

Technical levels to watch

XAG/USD

Overview
Today last price22.69
Today Daily Change0.20
Today Daily Change %0.89
Today daily open22.49
 
Trends
Daily SMA2023.72
Daily SMA5024.25
Daily SMA10025.64
Daily SMA20025.86
 
Levels
Previous Daily High22.72
Previous Daily Low22.24
Previous Weekly High23.97
Previous Weekly Low22.33
Previous Monthly High26
Previous Monthly Low22.17
Daily Fibonacci 38.2%22.54
Daily Fibonacci 61.8%22.43
Daily Pivot Point S122.25
Daily Pivot Point S222.01
Daily Pivot Point S321.77
Daily Pivot Point R122.73
Daily Pivot Point R222.97
Daily Pivot Point R323.21

Author

Haresh Menghani

Haresh Menghani is a detail-oriented professional with 10+ years of extensive experience in analysing the global financial markets.

More from Haresh Menghani
Share:

Editor's Picks

EUR/USD: US Dollar comeback in the makes?

The US Dollar stands victorious at the end of another week, with the EUR/USD pair trading near a four-week low of 1.1742, while the USD retains its strength despite some discouraging American data released at the end of the week. The pair edged higher on Friday, after the United States Supreme Court ruled against President Donald Trump's tariffs, although the advance is not enough to change the latest USD flow.

GBP/USD braces for more pain, as 200-day SMA tested

GBP/USD broke the previous week’s consolidation to the downside, as sellers returned with pomp, smashing the major back toward the levels last seen in late January. The pair tested bids below the 1.3450 barrier as the US Dollar strength largely played out throughout the week, while the Pound Sterling stepped back on expectations of divergent monetary policy outlooks between the Bank of England and the US Federal Reserve.

Gold climbs to weekly tops, approaches $5,100/oz

Gold keeps the bid tone well in place at the end of the week, now hitting fresh weekly highs and retargeting the key $5,100 mark per troy ounce. The move higher in the yellow metal comes in response to ongoing geopolitical tensions in the Middle East and modest losses in the US Dollar.

Week ahead: Markets brace for heightened volatility as event risk dominates

Dollar strength dominates markets as risk appetite remains subdued. A Supreme Court ruling, geopolitics and Fed developments are in focus. Pivotal Nvidia earnings on Wednesday as investors question tech sector weakness. Yen and aussie diverge; both pound and euro could recoup their losses.

Broadening drivers of growth: Unpacking GDP and looking ahead

This week’s data delivered a familiar theme with an important twist. The U.S. economy continues to be shaped by powerful forces in high-tech and AI-related investment, but recent releases suggest the growth story may finally be broadening. At the same time, trade flows are moving in a less supportive direction, reminding us that not all parts of the economy are pulling in sync.

Ripple bulls defend key support amid waning retail demand and ETF inflows

XRP ticks up above $1.40 support, but waning retail demand suggests caution. XRP attracts $4 million in spot ETF inflows on Thursday, signaling renewed institutional investor interest.