Silver Price Analysis: XAG/USD dives to 14-month lows below $21.65


  • Silver prices plunge to a year-to-date low at $21.50.
  • XAG/USD dives on US dollar strength and a risk-on mood.
  • Confirmation below $21.65 could send XAG/USD to test $20.00.

Silver prices have accelerated their downtrend on Wednesday, breaching recent lows at the $22.00 area and extending beyond September 2020 lows at $21.65 to reach $21.50 so far, the cheapest price since July last year.

US dollar strength and an improved risk appetite are crushing metal prices

The solid dollar rally, with the US Dollar Index surging to YTD prices beyond 94.00 on the back of higher US bond yields amid prospects of upcoming bonds buying tapering by the Federal Reserve, is hurting dollar-denominated metals.

Beyond that, the improved market sentiment, with the main stock markets in Europe and the US posting a solid rebound after Tuesday’s sell-off and the upbeat US pending home sales data have increased selling pressure for silver and other precious metals.

XAG/USD: attempting to confirm the breach of $21.65 low

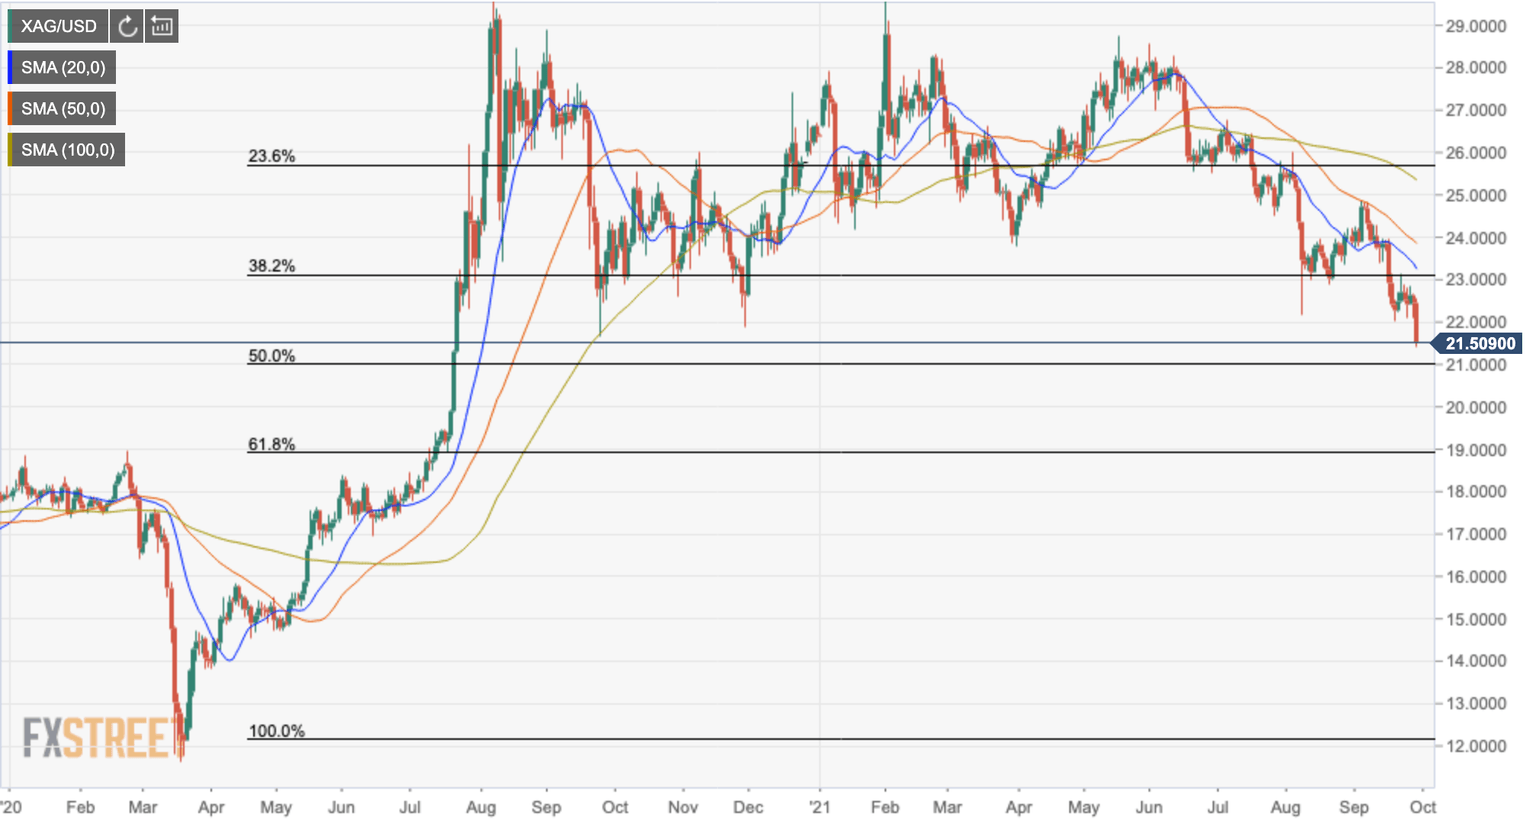
The daily chart shows the spot silver prices struggling against September 2020 lows at $21.65. If the pair manages to extend lower, the next support level might be at $21.00, the 50% retracement of the March-August 2020 rally, and then probably $20.00 psychological level.

On the upside, the pair should return above September 22 and 24 lows at $22.00/10 to attempt another attack to September 21 high at $23.00, where the 32.2% Fib retracement level might also offer some resistance ahead of September 16 high at $23.95.

XAG/USD daily chart

XAG/USD daily chart

Technical levels to watch

XAG/USD

Overview
Today last price 21.5
Today Daily Change -0.95
Today Daily Change % -4.23
Today daily open 22.45
 
Trends
Daily SMA20 23.39
Daily SMA50 23.93
Daily SMA100 25.41
Daily SMA200 25.78
 
Levels
Previous Daily High 22.67
Previous Daily Low 22.1
Previous Weekly High 23.15
Previous Weekly Low 22.04
Previous Monthly High 26
Previous Monthly Low 22.17
Daily Fibonacci 38.2% 22.32
Daily Fibonacci 61.8% 22.45
Daily Pivot Point S1 22.15
Daily Pivot Point S2 21.84
Daily Pivot Point S3 21.58
Daily Pivot Point R1 22.72
Daily Pivot Point R2 22.98
Daily Pivot Point R3 23.28


Share: Feed news

Information on these pages contains forward-looking statements that involve risks and uncertainties. Markets and instruments profiled on this page are for informational purposes only and should not in any way come across as a recommendation to buy or sell in these assets. You should do your own thorough research before making any investment decisions. FXStreet does not in any way guarantee that this information is free from mistakes, errors, or material misstatements. It also does not guarantee that this information is of a timely nature. Investing in Open Markets involves a great deal of risk, including the loss of all or a portion of your investment, as well as emotional distress. All risks, losses and costs associated with investing, including total loss of principal, are your responsibility. The views and opinions expressed in this article are those of the authors and do not necessarily reflect the official policy or position of FXStreet nor its advertisers. The author will not be held responsible for information that is found at the end of links posted on this page.

If not otherwise explicitly mentioned in the body of the article, at the time of writing, the author has no position in any stock mentioned in this article and no business relationship with any company mentioned. The author has not received compensation for writing this article, other than from FXStreet.

FXStreet and the author do not provide personalized recommendations. The author makes no representations as to the accuracy, completeness, or suitability of this information. FXStreet and the author will not be liable for any errors, omissions or any losses, injuries or damages arising from this information and its display or use. Errors and omissions excepted.

The author and FXStreet are not registered investment advisors and nothing in this article is intended to be investment advice.

Recommended content


Recommended content

Editors’ Picks

EUR/USD edges lower toward 1.0700 post-US PCE

EUR/USD edges lower toward 1.0700 post-US PCE

EUR/USD stays under modest bearish pressure but manages to hold above 1.0700 in the American session on Friday. The US Dollar (USD) gathers strength against its rivals after the stronger-than-forecast PCE inflation data, not allowing the pair to gain traction.

EUR/USD News

GBP/USD retreats to 1.2500 on renewed USD strength

GBP/USD retreats to 1.2500 on renewed USD strength

GBP/USD lost its traction and turned negative on the day near 1.2500. Following the stronger-than-expected PCE inflation readings from the US, the USD stays resilient and makes it difficult for the pair to gather recovery momentum.

GBP/USD News

Gold struggles to hold above $2,350 following US inflation

Gold struggles to hold above $2,350 following US inflation

Gold turned south and declined toward $2,340, erasing a large portion of its daily gains, as the USD benefited from PCE inflation data. The benchmark 10-year US yield, however, stays in negative territory and helps XAU/USD limit its losses. 

Gold News

Bitcoin Weekly Forecast: BTC’s next breakout could propel it to $80,000 Premium

Bitcoin Weekly Forecast: BTC’s next breakout could propel it to $80,000

Bitcoin’s recent price consolidation could be nearing its end as technical indicators and on-chain metrics suggest a potential upward breakout. However, this move would not be straightforward and could punish impatient investors. 

Read more

Week ahead – Hawkish risk as Fed and NFP on tap, Eurozone data eyed too

Week ahead – Hawkish risk as Fed and NFP on tap, Eurozone data eyed too

Fed meets on Wednesday as US inflation stays elevated. Will Friday’s jobs report bring relief or more angst for the markets? Eurozone flash GDP and CPI numbers in focus for the Euro.

Read more

Forex MAJORS

Cryptocurrencies

Signatures