|

Silver Price Analysis: XAG/USD dives below the 100/200-DMA, turns bearish, eyeing $21.00

  • Silver shifted bearish following Thursday’s daily close below the 200-DMA
  • Silver Price Analysis: A downward condition is expected with price action and RSI’s coinciding on its bearish bias.

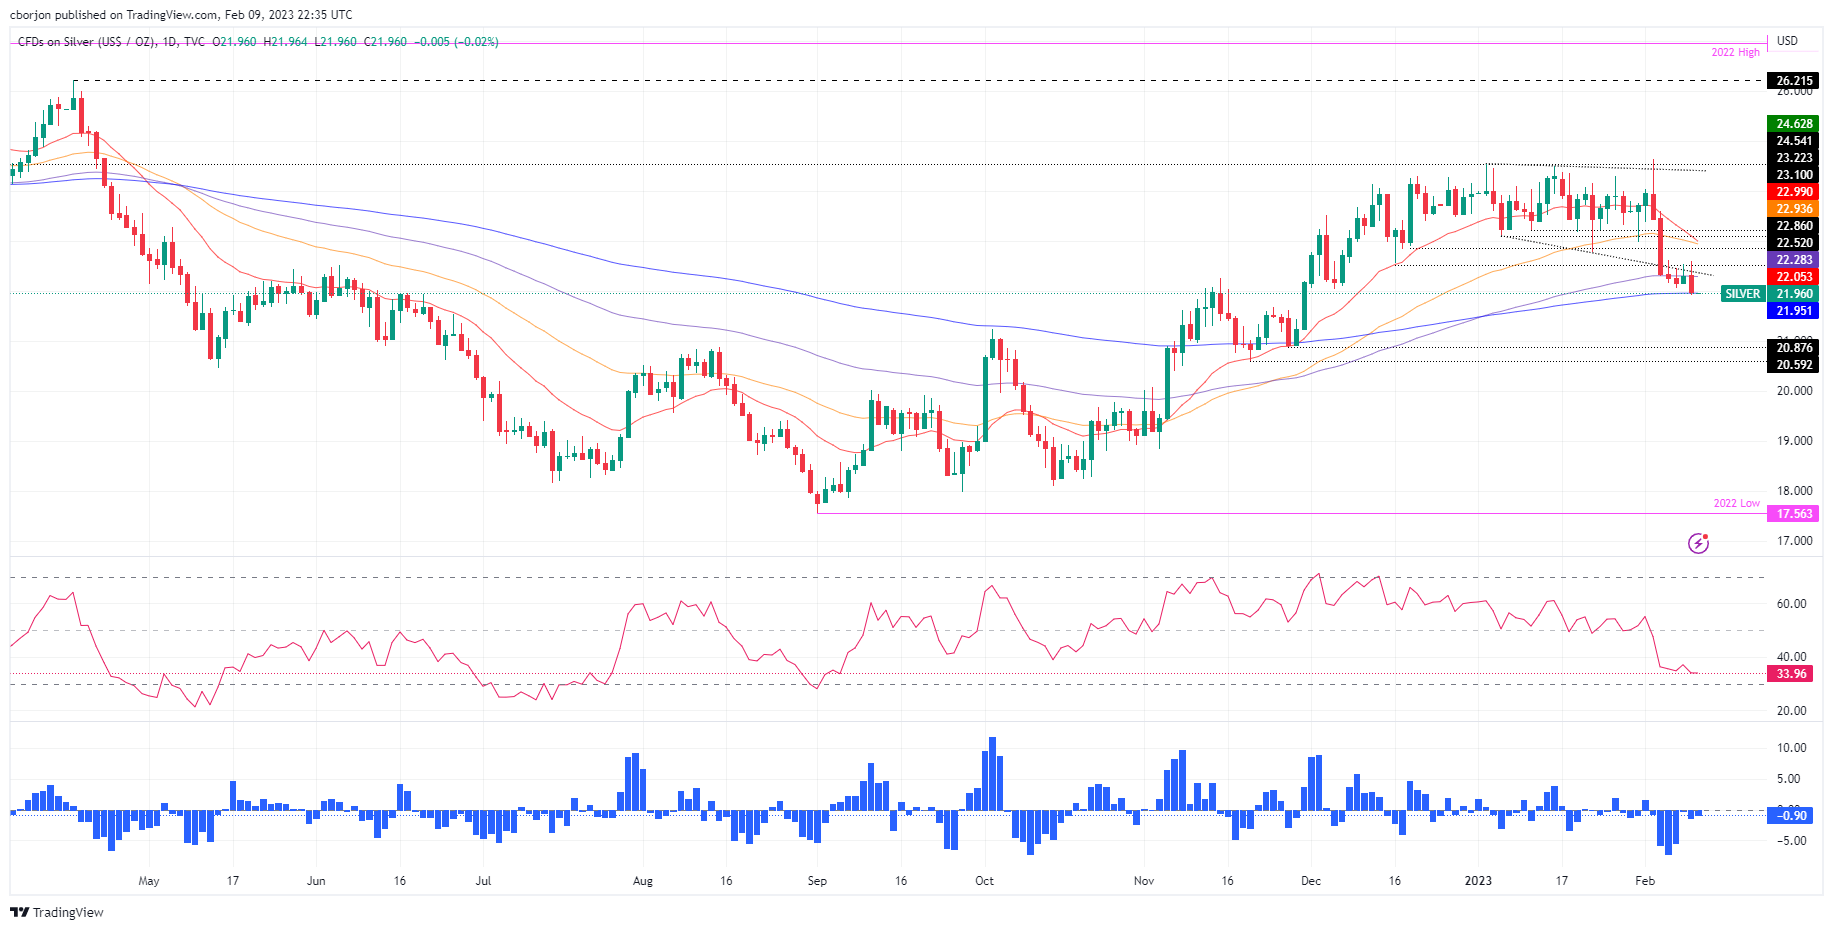
Silver price slides below a bottom-trend line of a bearish megaphone formation and is testing the 200-day Exponential Moving Average (EMA) at around $21.95. At the time of writing, the XAG/USD exchanges hands at $21.97.

From a daily chart perspective, XAG/USD threatens to crack the 200-day EMA, which, if accomplished, it could pave the way for further losses. In addition, oscillators turned bearish, notably the Relative Strength Index (RSI), while the Rate of Change (RoC) is almost flat, depicting that neither buyers/sellers are in control.

However, XAG/USD’s daily close below the 200-day EMA could send Silver prices diving. The next support area would be the $21.00 psychological price level, followed by the November 28 daily low of $20.87 and the November 21 low of $20.59.

As an alternate scenario, the XAG/USD’s first resistance would be the psychological $22.00 mark. A breach of the latter would expose a support-turned-resistance bottom trendline of the megaphone formation at $22.40, followed by the high of the week at $22.59.

Silver Daily Chart

Silver key technical levels

XAG/USD

Overview
Today last price21.98
Today Daily Change-0.31
Today Daily Change %-1.39
Today daily open22.29
 
Trends
Daily SMA2023.49
Daily SMA5023.47
Daily SMA10021.77
Daily SMA20021.01
 
Levels
Previous Daily High22.54
Previous Daily Low22.14
Previous Weekly High24.64
Previous Weekly Low22.29
Previous Monthly High24.55
Previous Monthly Low22.76
Daily Fibonacci 38.2%22.39
Daily Fibonacci 61.8%22.29
Daily Pivot Point S122.11
Daily Pivot Point S221.92
Daily Pivot Point S321.71
Daily Pivot Point R122.51
Daily Pivot Point R222.72
Daily Pivot Point R322.91

Author

Christian Borjon Valencia

Markets analyst, news editor, and trading instructor with over 14 years of experience across FX, commodities, US equity indices, and global macro markets.

More from Christian Borjon Valencia
Share:

Editor's Picks

AUD/USD eyes 0.7150 barrier nine-day EMA

AUD/USD inches higher after registering modest losses in the previous day, trading around 0.7130 during the Asian hours. The technical analysis of the daily chart indicates that the pair is moving sideways within the rectangle pattern, suggesting a consolidation as neither the bulls nor the bears have enough momentum to take control of the market.

USD/JPY trades below 160.00 intervention threshold; bullish bias intact

The USD/JPY pair attracts some sellers during the Asian session amid fears that authorities will step in again to prop up the Japanese Yen. Furthermore, the Israel-Lebanon truce prompts some profit-taking around the US Dollar and exerts downward pressure on the currency pair.

Gold extends rebound to $4,500 as US yields edge lower

Gold (XAU/USD) preserves its recovery momentum following Wednesday's slide and tests the $4,500 mark in the second half of the day on Thursday. While US-Iran uncertainty remains, easing tensions between Lebanon on Israel seems to be helping the market mood improve, causing the USD to lose strength alongside falling US T-bond yields and opening the door for a decisive rebound in XAU/USD.

Hyperliquid: ETF demand, capital rotation fuel HYPE rally as Bitcoin melts

Hyperliquid price sustains an upward trend near its all-time high of $75.76 on Thursday after posting 80% gains in May, while Bitcoin (BTC) retraces below $65,000, triggering a market-wide panic.

Nonfarm payrolls: Testing the limits of Fed policy patience

The upcoming nonfarm payrolls report for May will provide the final update on the US labor market before Kevin Warsh attends his first policy meeting as the new Fed Chair later this month.

Recession on paper: What really moves the Canadian Loonie now?

Statistics Canada handed the headline writers a gift and the analysts a headache. Real GDP shrank 0.1% on an annualized basis in the first quarter, and with the fourth quarter of 2025 revised down to a 1.0% contraction, that is two negative quarters in a row, the textbook definition of a technical recession and Canada's first since the pandemic.