Silver Price Analysis: XAG/USD dips as 'bearish harami' signals pullback
- Silver retreats beneath $31.00 after hitting a daily high of $31.36, forming a bearish harami pattern.
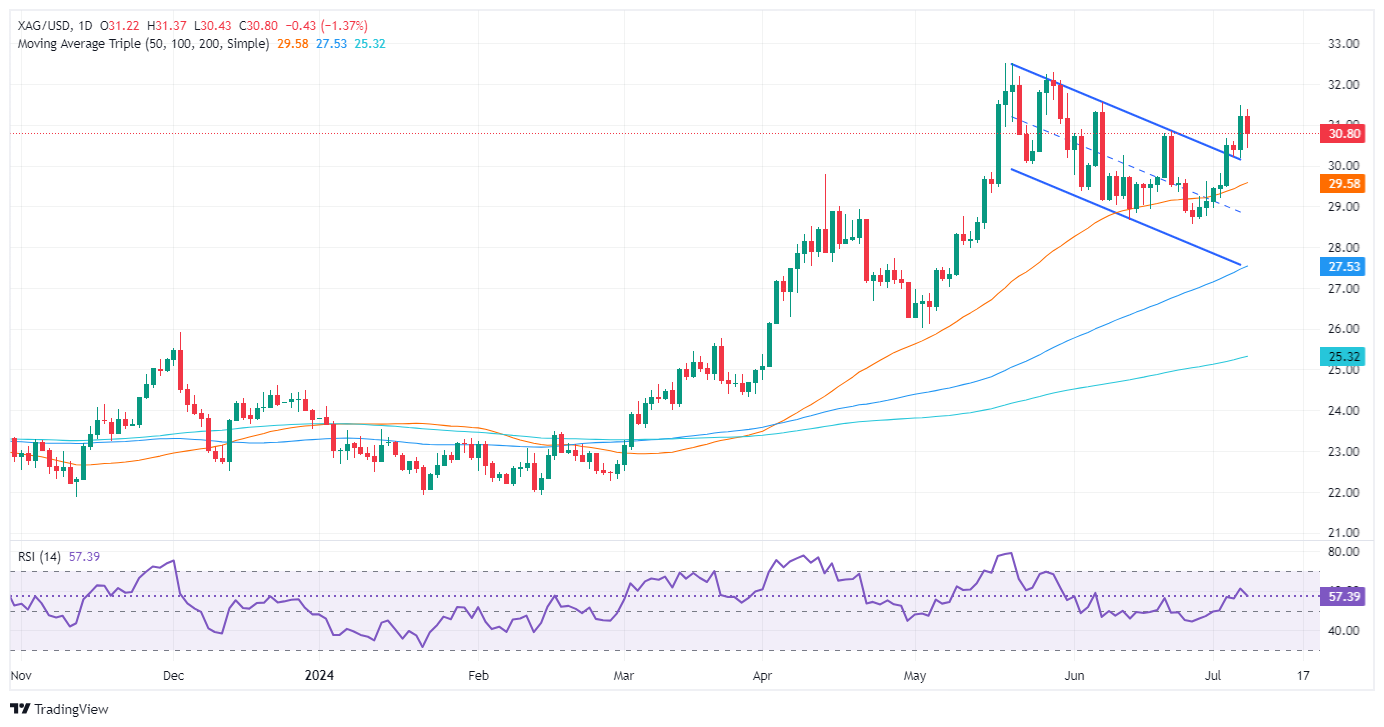
- Support levels to watch: $30.81 (June 21 high) and $30.18 (July 5 low).
- Bullish targets: $31.49 (July 5 high) and YTD high of $32.51 if upward momentum resumes.

Silver price trims some of its last Friday’s gains. It forms a ‘bearish harami’ candlestick chart pattern, an indication that buyers were unable to capitalize on US Dollar weakness to push the grey metal price above last week’s high of $31.49. Therefore, XAG/USD reversed its course after hitting a daily high of $31.36, trading at $30.79, down more than 1.30%.
XAG/USD Price Analysis: Technical outlook
Silver is upward biased, and as I wrote in an article, XAG “has cleared the ‘double bottom’ neckline at the time of writing, validating the chart pattern.” Nevertheless, today’s formation of a bearish chart pattern could pave the way for a pullback.
If XAG/USD sellers drag the spot price below the June 21 high of $30.81, that will expose the next support at the July 5 low of $30.18. On further weakness, the non-yielding metal would likely drop toward the $30.00 figure, with sellers eyeing a test of the 50-day moving average (DMA).
For a bullish continuation, the XAG/USD must clear the July 5 high at $31.49, clearing the path to challenging the $32.00 figure. Up next would be the year-to-date (YTD) high of $32.51.
XAG/USD Price Action – Daily Chart
Silver FAQs
Silver is a precious metal highly traded among investors. It has been historically used as a store of value and a medium of exchange. Although less popular than Gold, traders may turn to Silver to diversify their investment portfolio, for its intrinsic value or as a potential hedge during high-inflation periods. Investors can buy physical Silver, in coins or in bars, or trade it through vehicles such as Exchange Traded Funds, which track its price on international markets.
Silver prices can move due to a wide range of factors. Geopolitical instability or fears of a deep recession can make Silver price escalate due to its safe-haven status, although to a lesser extent than Gold's. As a yieldless asset, Silver tends to rise with lower interest rates. Its moves also depend on how the US Dollar (USD) behaves as the asset is priced in dollars (XAG/USD). A strong Dollar tends to keep the price of Silver at bay, whereas a weaker Dollar is likely to propel prices up. Other factors such as investment demand, mining supply – Silver is much more abundant than Gold – and recycling rates can also affect prices.
Silver is widely used in industry, particularly in sectors such as electronics or solar energy, as it has one of the highest electric conductivity of all metals – more than Copper and Gold. A surge in demand can increase prices, while a decline tends to lower them. Dynamics in the US, Chinese and Indian economies can also contribute to price swings: for the US and particularly China, their big industrial sectors use Silver in various processes; in India, consumers’ demand for the precious metal for jewellery also plays a key role in setting prices.
Silver prices tend to follow Gold's moves. When Gold prices rise, Silver typically follows suit, as their status as safe-haven assets is similar. The Gold/Silver ratio, which shows the number of ounces of Silver needed to equal the value of one ounce of Gold, may help to determine the relative valuation between both metals. Some investors may consider a high ratio as an indicator that Silver is undervalued, or Gold is overvalued. On the contrary, a low ratio might suggest that Gold is undervalued relative to Silver.
Author

Christian Borjon Valencia
FXStreet
Markets analyst, news editor, and trading instructor with over 14 years of experience across FX, commodities, US equity indices, and global macro markets.


