• XAG/USD reclaims the 100-day EMA at $23.47 after dipping to a daily low, showcasing a subtle comeback.
  • Despite the recovery, the market remains neutral to downward biased as XAG/USD fails to reconquer the April 25 daily low.
  • Technical indicators suggest a battle between sellers and incoming buyers, hinting at volatility in the XAG/USD market.

XAG/USD stages a comeback though it remains slightly below its opening price, reclaimed the 100-day Exponential Moving Average (EMA) at $23.47 after hitting a daily low of $23.25. At the time of writing, XAG/USD exchanges hands at $23.55, down 0.14%

XAG/USD Price Analysis: Technical outlook

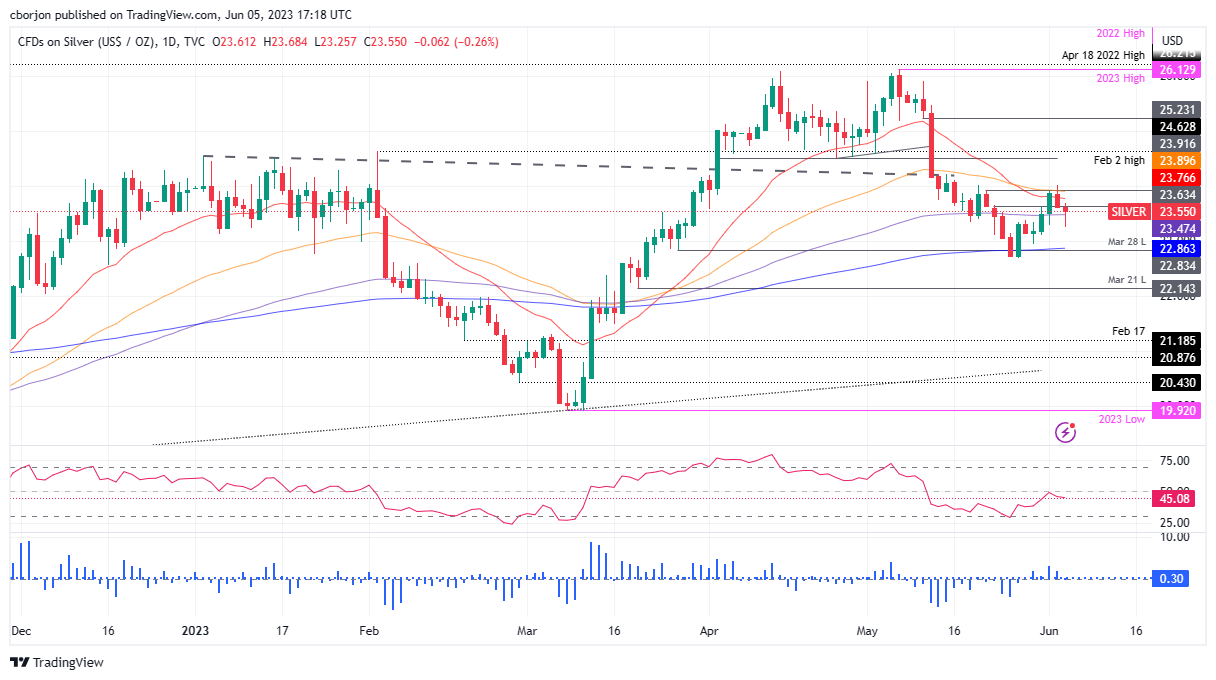
From a daily chart perspective, the XAG/USD is neutral to downward biased, as price action has failed to reconquer the April 25 daily low of $24.49, which could pave the way for further upside. In addition, the Relative Strength Index (RSI) indicator at bearish territory suggests that sellers are in charge, while the 3-day Rate of Change (RoC) indicates that buyers are moving in, cushioning the XAG/USD’s fall.

For a bearish resumption, XAG/USD must fall below the 100-day EMA at $23.47 to force a downward move to the $23.00 figure. A breach of the latter will expose the 200-day Exponential Moving Average (EMA) at $22.86.

Conversely, if XAG/USD buyers reclaim the 20-day EMA at $23.76, a rally toward the $24.00 is on the cards. But on its way north lies the 50-day EMA at $23.89.

XAG/USD Price Action – Daily chart

XAG/USD Daily chart

XAG/USD

Overview
Today last price 23.56
Today Daily Change -0.05
Today Daily Change % -0.21
Today daily open 23.61
 
Trends
Daily SMA20 23.86
Daily SMA50 24.45
Daily SMA100 23.36
Daily SMA200 22.12
 
Levels
Previous Daily High 24.02
Previous Daily Low 23.58
Previous Weekly High 24.02
Previous Weekly Low 22.93
Previous Monthly High 26.14
Previous Monthly Low 22.68
Daily Fibonacci 38.2% 23.75
Daily Fibonacci 61.8% 23.85
Daily Pivot Point S1 23.45
Daily Pivot Point S2 23.3
Daily Pivot Point S3 23.01
Daily Pivot Point R1 23.9
Daily Pivot Point R2 24.18
Daily Pivot Point R3 24.34


Share: Feed news

Information on these pages contains forward-looking statements that involve risks and uncertainties. Markets and instruments profiled on this page are for informational purposes only and should not in any way come across as a recommendation to buy or sell in these assets. You should do your own thorough research before making any investment decisions. FXStreet does not in any way guarantee that this information is free from mistakes, errors, or material misstatements. It also does not guarantee that this information is of a timely nature. Investing in Open Markets involves a great deal of risk, including the loss of all or a portion of your investment, as well as emotional distress. All risks, losses and costs associated with investing, including total loss of principal, are your responsibility. The views and opinions expressed in this article are those of the authors and do not necessarily reflect the official policy or position of FXStreet nor its advertisers. The author will not be held responsible for information that is found at the end of links posted on this page.

If not otherwise explicitly mentioned in the body of the article, at the time of writing, the author has no position in any stock mentioned in this article and no business relationship with any company mentioned. The author has not received compensation for writing this article, other than from FXStreet.

FXStreet and the author do not provide personalized recommendations. The author makes no representations as to the accuracy, completeness, or suitability of this information. FXStreet and the author will not be liable for any errors, omissions or any losses, injuries or damages arising from this information and its display or use. Errors and omissions excepted.

The author and FXStreet are not registered investment advisors and nothing in this article is intended to be investment advice.

Recommended content


Recommended content

Editors’ Picks

Forex MAJORS

Cryptocurrencies

Signatures