|

Silver Price Analysis: XAG/USD collapses below 50-DMA as surrenders $29.00

  • Silver drops to $28.90, under 50-day MA, after Fed's Bowman's hawkish remarks.
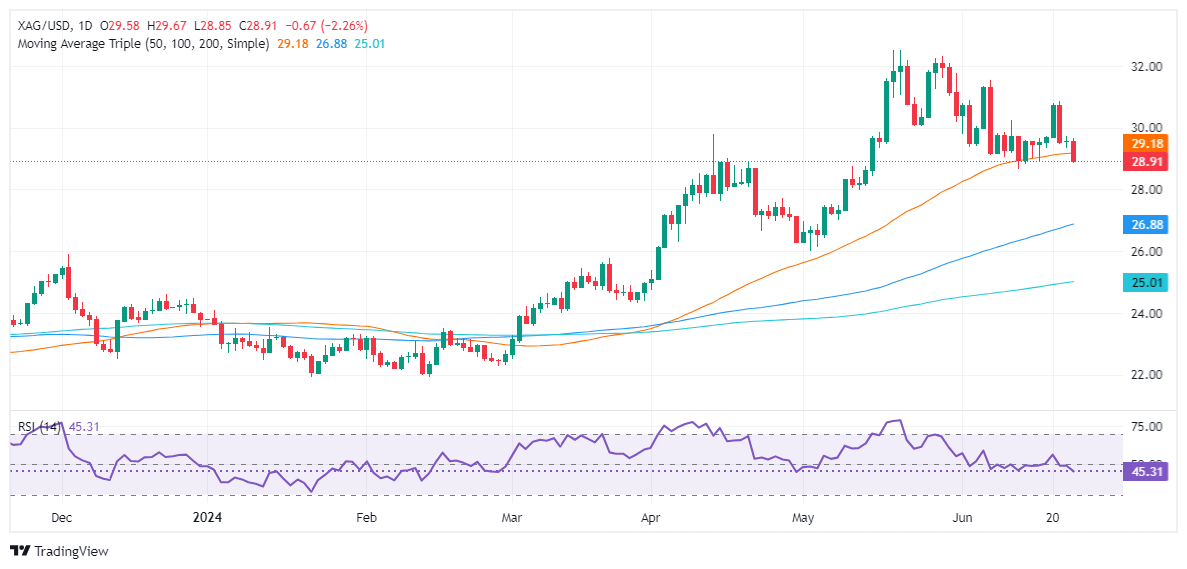
  • Bearish pattern evident, with RSI suggesting further downside.
  • Support levels: $28.74 (May 18 high), $28.28 (June 10 high), $28.00, $26.82 (100-DMA).
  • Resistance points: $29.16 (50-DMA), $31.54 (June 7 high), $32.00, $32.51 (YTD high).

Silver price collapsed on Tuesday amid a strong US Dollar, sponsored by hawkish comments by Fed Governor Michelle Bowman. Although US Treasury yields were unchanged, the Greenback registered moderate gains, which weighed on the grey metal. The XAG/USD trades at $28.90, below its 50-day moving average (DMA) for the first time since March 1.

XAG/USD Price Analysis: Technical outlook

The grey metal formed a ‘bearish engulfing’ chart pattern last week, which opened the door for further downside. Momentum favors sellers, as shown by the Relative Strength Index (RSI), which stands bearish. This suggests that Silver could extend its losses.

Hence, the XAG/USD's first support would be the May 18, 2021, high turned support at $28.74, ahead of challenging June 10, 2021, high at $28.28. Key support levels lie underneath, like the $28.00 figure, followed by the 100-DMA at $26.82.

Conversely, if XAG/USD resumes its uptrend, the next resistance level would be the 50-day moving average (DMA) at $29.16. Once surpassed, the next stop is the June 7 high of $31.54. Clearing this level would target $32.00 before challenging the year-to-date (YTD) high of $32.51.

XAG/USD Price Action – Daily Chart

XAG/USD

Overview
Today last price28.91
Today Daily Change-0.67
Today Daily Change %-2.27
Today daily open29.58
 
Trends
Daily SMA2030.11
Daily SMA5029.16
Daily SMA10026.81
Daily SMA20024.98
 
Levels
Previous Daily High29.73
Previous Daily Low29.35
Previous Weekly High30.86
Previous Weekly Low28.93
Previous Monthly High32.51
Previous Monthly Low26.02
Daily Fibonacci 38.2%29.58
Daily Fibonacci 61.8%29.49
Daily Pivot Point S129.38
Daily Pivot Point S229.17
Daily Pivot Point S329
Daily Pivot Point R129.75
Daily Pivot Point R229.93
Daily Pivot Point R330.13

Author

Christian Borjon Valencia

Christian Borjon began his career as a retail trader in 2010, mainly focused on technical analysis and strategies around it. He started as a swing trader, as he used to work in another industry unrelated to the financial markets.

More from Christian Borjon Valencia
Share:

Markets move fast. We move first.

Orange Juice Newsletter brings you expert driven insights - not headlines. Every day on your inbox.

By subscribing you agree to our Terms and conditions.

Editor's Picks

EUR/USD bounces toward 1.1750 as US Dollar loses strength

EUR/USD returned to the 1.1750 price zone in the American session on Friday, despite falling Wall Street, which indicates risk aversion. Trading conditions remain thin following the New Year holiday and ahead of the weekend, with the focus shifting to US employment and European data scheduled for next week.

GBP/USD nears 1.3500, holds within familiar levels

After testing 1.3400 on the last day of 2025, GBP/USD managed to stage a rebound. Nevertheless, the pair finds it difficult to gather momentum and trades with modest intraday gains at around 1.3490 as market participants remain in holiday mood.

Gold trims intraday gains, approaches $4,300

Gold retreated sharply from the $4,400  area and trades flat for the day in the $4,320 price zone. Choppy trading conditions exacerbated the intraday decline, although XAU/USD bearish case is out of the picture, considering growing expectations for a dovish Fed and persistent geopolitical tensions.

Cardano gains early New Year momentum, bulls target falling wedge breakout

Cardano kicks off the New Year on a positive note and is extending gains, trading above $0.36 at the time of writing on Friday. Improving on-chain and derivatives data point to growing bullish interest, while the technical outlook keeps an upside breakout in focus.

Economic outlook 2026-2027 in advanced countries: Solidity test

After a year marked by global economic resilience and ending on a note of optimism, 2026 looks promising and could be a year of solid economic performance. In our baseline scenario, we expect most of the supportive factors at work in 2025 to continue to play a role in 2026.

Crypto market outlook for 2026

Year 2025 was volatile, as crypto often is.  Among positive catalysts were favourable regulatory changes in the U.S., rise of Digital Asset Treasuries (DAT), adoption of AI and tokenization of Real-World-Assets (RWA).