Silver Price Analysis: XAG/USD bulls need to wait for move beyond $23.30-35 confluence hurdle
- Silver regains positive traction on Thursday and climbs back to the $23.00 round-figure mark.
- The technical setup seems tilted in favour of bulls and supports prospects for additional gain.
- A convincing break below the 38.2% Fibo. level is needed to negate the constructive outlook.

Silver attracts fresh buying on Thursday following the previous day's sharp retracement slide from the $23.30-$23.35 area, or a near three-week high and extends its steady ascent through the early European session. The white metal climbs back closer to the $23.00 mark and seems poised to prolong its recent goodish recovery from a seven-month low touched on October 3.
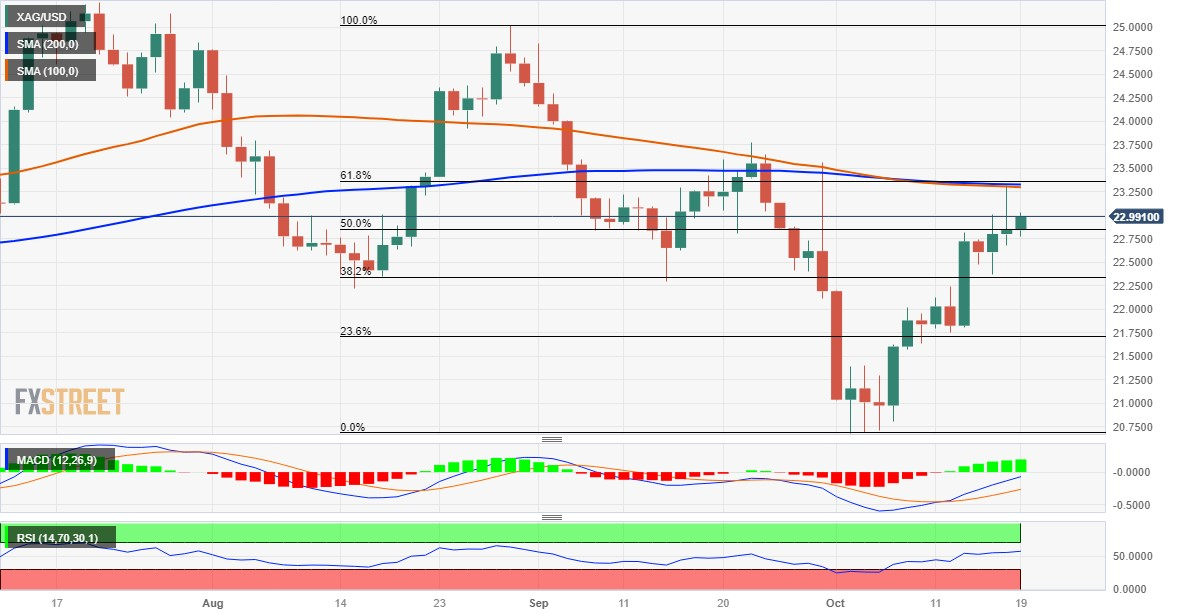
From a technical perspective, acceptance above the 50% Fibonacci retracement level of the August-October downfall validates the constructive outlook for the XAG/USD. Furthermore, oscillators on the daily chart have just started gaining positive traction and support prospects for a further appreciating move. That said, the overnight failure near the $23.30-$23.35 confluence hurdle – comprising the 100-day and the 200-day Simple Moving Averages (SMAs) and the 61.8% Fibo. level – warrants some caution.
Hence, it will be prudent to wait for a sustained break through the aforementioned barrier before positioning for any further gains. The XAG/USD might then accelerate the positive move towards the next relevant resistance near the $23.75-$23.80 region (September 22 high) and then aim towards reclaiming the $24.00 round figure for the first time since early September. The momentum could get extended further towards the $24.30-$24.35 resistance zone.
On the flip side, the 50% Fibo. level, around the $22.85 region, now seems to protect the immediate downside ahead of the overnight swing low, around the $22.70-$22.65 area. Some follow-through selling might expose the weekly trough, around the $22.40-$22.35 zone. The latter nears the 38.2% Fibo. level and should act as a key pivotal point. A convincing break below might shift the near-term bias back in favour of bearish traders and prompt aggressive technical selling around the XAG/USD.
The subsequent downfall will make the commodity vulnerable to weaken further below the $22.00 mark, towards the 23.6% Fibo. level, around the $21.75 area. Failure to defend the said support levels has the potential to drag the XAG/USD further towards the $21.35-$21.30 intermediate support en route to the $21.00 mark and back towards retesting a seven-month low, around the $20.70-$20.65 zone, or a seven-month low touched on October 3.
Silver daily chart
Technical levels to watch
Author

Haresh Menghani
FXStreet
Haresh Menghani is a detail-oriented professional with 10+ years of extensive experience in analysing the global financial markets.