- Silver gains strong traction for the second straight day and recovers further from a multi-month low.
- The intraday technical setup favours bullish traders and supports prospects for additional gains.
- Weakness back below the 23.6% Fibo. will negate the positive bias and expose the $22.00 mark.
Silver builds on Friday's modest bounce from the $22.10 area, or its lowest level since March 17 and gains strong follow-through traction on the first day of a new week. The upward trajectory remains unabated through the early part of the European session and lifts the white metal to a three-day high, around the $22.85 region in the last hour.
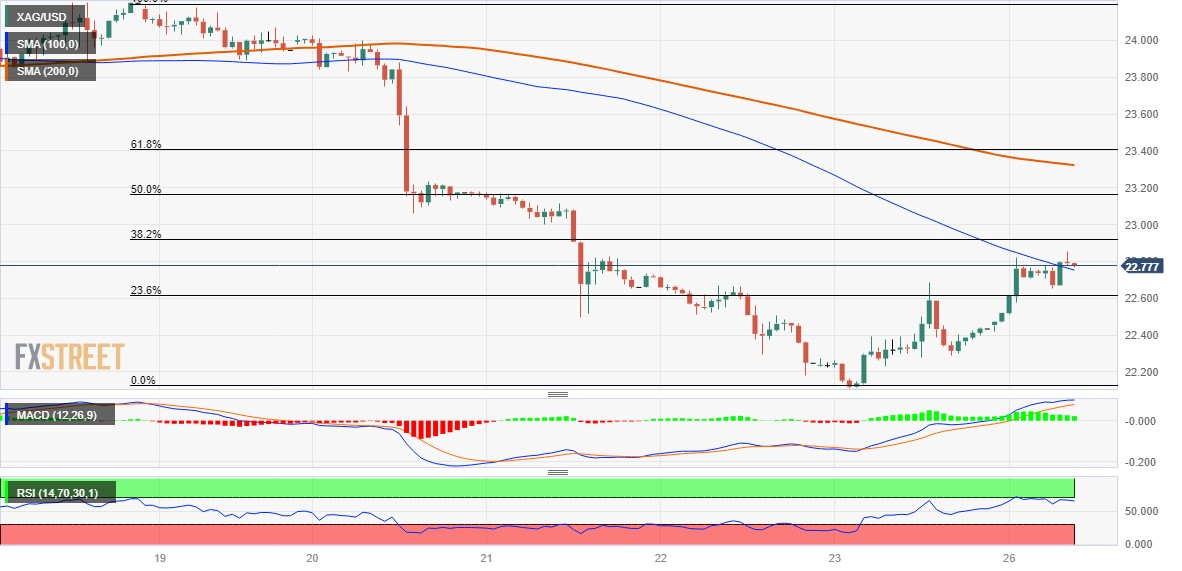
From a technical perspective, the XAG/USD has now moved back above the 100-hour Simple Moving Average (SMA) and is currently placed around the 38.2% Fibonacci retracement level of the downfall witnessed over the past week or so. A sustained strength beyond might trigger a fresh bout of a short-covering rally and lift the commodity beyond the $23.00 mark, towards testing the 50% Fibo. level, around the $23.15 region.
The recovery could get extended to the $23.35-$23.40 confluence, comprising the 200-hour SMA and the 61.8% Fibo. level, which should now act as a pivotal point. Given that oscillators on the daily chart are still holding in the negative territory, bulls might wait for some follow-through buying beyond the said barrier before confirming that the XAG/USD has formed a bottom ahead of the $22.00 mark and positioning for any further gains.
On the flip side, weakness back below the 23.6% Fibo. level, around the $22.60 area, will expose the multi-month low, around the $22.10 region. Some follow-through selling below the $22.00 mark will be seen as a fresh trigger for bearish traders and make the XAG/USD accelerate the slide towards the $21.70-$21.65 support zone. The downward trajectory could get extended further towards the $21.25 support en route to the $21.00 round figure.
The next relevant support is pegged near the $20.50 area, below which the XAG/USD might eventually aim towards challenging the YTD low, levels just below the $20.00 psychological mark touched in March.
Silver 1-hour chart
Key levels to watch
Information on these pages contains forward-looking statements that involve risks and uncertainties. Markets and instruments profiled on this page are for informational purposes only and should not in any way come across as a recommendation to buy or sell in these assets. You should do your own thorough research before making any investment decisions. FXStreet does not in any way guarantee that this information is free from mistakes, errors, or material misstatements. It also does not guarantee that this information is of a timely nature. Investing in Open Markets involves a great deal of risk, including the loss of all or a portion of your investment, as well as emotional distress. All risks, losses and costs associated with investing, including total loss of principal, are your responsibility. The views and opinions expressed in this article are those of the authors and do not necessarily reflect the official policy or position of FXStreet nor its advertisers. The author will not be held responsible for information that is found at the end of links posted on this page.
If not otherwise explicitly mentioned in the body of the article, at the time of writing, the author has no position in any stock mentioned in this article and no business relationship with any company mentioned. The author has not received compensation for writing this article, other than from FXStreet.
FXStreet and the author do not provide personalized recommendations. The author makes no representations as to the accuracy, completeness, or suitability of this information. FXStreet and the author will not be liable for any errors, omissions or any losses, injuries or damages arising from this information and its display or use. Errors and omissions excepted.
The author and FXStreet are not registered investment advisors and nothing in this article is intended to be investment advice.
Recommended content
Editors’ Picks
EUR/USD clings to gains above 1.0850 after US inflation data
EUR/USD trades in positive territory above 1.0850 in the American session on Friday. The US Dollar struggles to preserve its strength following the April PCE inflation data and helps the pair hold its ground heading into the weekend.
GBP/USD retreats from 1.2765, holds on to modest gains
GBP/USD posted a two-day high peat at 1.2765 in the American session, as US data showed that the core PCE inflation held steady at 2.8% on a yearly basis in April. The pair retreated afterwards as risk aversion triggered US Dollar demand.
Gold falls towards $2,330 as the mood sours
US inflation-related data took its toll on financial markets. Wall Street turned south after the opening and without signs of easing price pressures in the world’s largest economy. The US Dollar takes the lead in a risk-averse environment.
Here’s why Chainlink price could crash 15% despite spike in social volume Premium
Chainlink price has flashed multiple sell signals after its recent climb, hinting at a short-term correction. This signal comes despite a double-digit growth in its social volume. LINK bulls need to exercise caution as this forecast is backed by on-chain metrics.
Week ahead – ECB rate cut might get eclipsed by BoC surprise and NFP report
ECB set to slash rates on Thursday, focus on forward guidance. But will the BoC take the lead when it meets on Wednesday? US jobs report eyed on Friday as Fed unyielding on cuts. OPEC+ might extend some output reductions into 2025.