|

Silver Price Analysis: XAG/USD bulls flirt with descending trend-line resistance

Silver trades with a positive bias for the third successive day on Thursday.
The technical setup warrants caution before positioning for further gains.
A convincing breakout through $23.00 is needed for bulls to seize control.

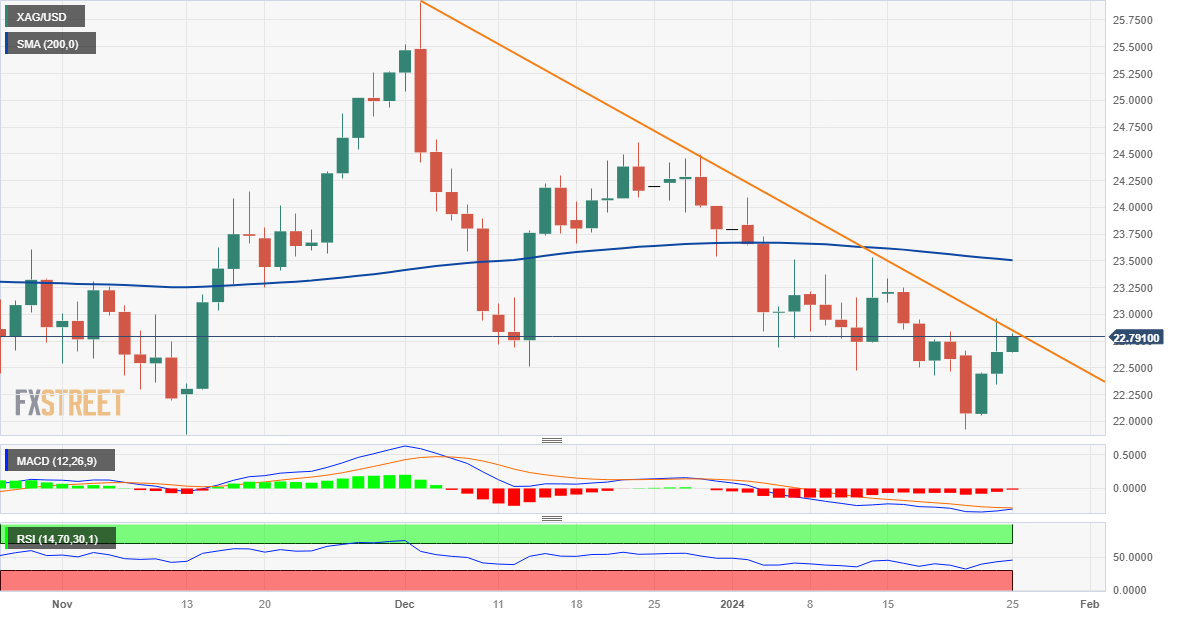
Silver (XAG/USD) attracts some buyers for the third successive day on Thursday and sticks to its modest intraday gains, near the $22.70-$22.75 region through the first half of the European session. The white metal, however, remains below the weekly top, around the $23.00 round figure touched the previous day.

The aforementioned handle represents a downward-sloping trend-line resistance extending from the December swing high and should act as a key pivotal point. A sustained strength beyond might trigger a short-covering rally and lift the XAG/USD to the $23.25-$23.30 intermediate resistance en route to the very important 200-day Simple Moving Average (SMA), currently around mid-$23.00s.

Some follow-through buying will suggest that the XAG/USD has bottomed out in the near term and pave the way for a move towards reclaiming the $24.00 round figure. The momentum could extend further towards the next relevant resistance near the $24.40-$24.50 area. That said, oscillators on the daily chart are yet to confirm a bullish bias and warrant some caution before positioning for further gains.

On the flip side, the $22.60-$22.55 zone now seems to protect the immediate downside, below which the XAG/USD could slide back to retesting over a two-month low, around the $21.95-$21.90 region touched on Monday. A convincing break below the latter will be seen as a fresh trigger for bearish traders and expose the $21.40-$21.35 support. The subsequent fall could drag the metal to the $21.00 round figure en route to the October monthly swing low, around the $20.70-$20.65 region.

Silver daily chart

fxsoriginal

Technical levels to watch

XAG/USD

Overview
Today last price22.75
Today Daily Change0.10
Today Daily Change %0.44
Today daily open22.65
 
Trends
Daily SMA2023.03
Daily SMA5023.65
Daily SMA10023.15
Daily SMA20023.52
 
Levels
Previous Daily High22.96
Previous Daily Low22.34
Previous Weekly High23.33
Previous Weekly Low22.42
Previous Monthly High25.92
Previous Monthly Low22.51
Daily Fibonacci 38.2%22.72
Daily Fibonacci 61.8%22.58
Daily Pivot Point S122.34
Daily Pivot Point S222.03
Daily Pivot Point S321.72
Daily Pivot Point R122.96
Daily Pivot Point R223.27
Daily Pivot Point R323.58

Author

Haresh Menghani

Haresh Menghani is a detail-oriented professional with 10+ years of extensive experience in analysing the global financial markets.

More from Haresh Menghani
Share:

Markets move fast. We move first.

Orange Juice Newsletter brings you expert driven insights - not headlines. Every day on your inbox.

By subscribing you agree to our Terms and conditions.

Editor's Picks

EUR/USD bears await break below 100-day SMA support near 1.1665 area

The EUR/USD pair attracts heavy selling for the second straight day and dives to a nearly four-week trough, around the 1.1670 region, during the Asian session on Monday. Bearish traders now await a sustained break below the 100-day Simple Moving Average before positioning for an extension of the recent pullback from a three-month top, or levels just above the 1.1800 mark touched on December 24.

GBP/USD falls toward 1.3400 near 50-day EMA

GBP/USD extends its losses for the second successive session, trading around 1.3420 during the Asian hours on Monday. The technical analysis of the daily chart indicates that the 14-day Relative Strength Index at 53 has eased from near overbought, indicating that momentum has cooled while remaining above the midline. RSI holds above 50, keeping a modest bullish bias.

Gold on fire at the start of the week on US-Venezuela tensions

Gold regains upside traction early Monday as flight to safety prevails on Venezuela turmoil. The US Dollar finds strong haven demand, caps Gold’s upside as focus shifts to US jobs data. Gold’s daily technical setup suggests that more upside remains in the offing.

Bulls firmly in control as Bitcoin breaks $93K, Ethereum and Ripple extend gains

Bitcoin, Ethereum, and Ripple extended their rallies on Monday, gaining more than 4%, 6%, and 12%, respectively, in the previous week. The top three cryptocurrencies by market capitalization could continue to outperform, with bulls in control of the momentum.

Economic outlook 2026-2027 in advanced countries: Solidity test

After a year marked by global economic resilience and ending on a note of optimism, 2026 looks promising and could be a year of solid economic performance. In our baseline scenario, we expect most of the supportive factors at work in 2025 to continue to play a role in 2026.

Meme Coins Price Prediction: Dogecoin, Shiba Inu, Pepe rally on Venezuela’s shadow BTC reserve

Meme coins such as Dogecoin, Shiba Inu, and Pepe are leading the cryptocurrency market rally driven by the US cross-border operation to capture Venezuelan President Nicolás Maduro. Dogecoin extends its gain for the fifth consecutive day while SHIB and PEPE take a pause.