|

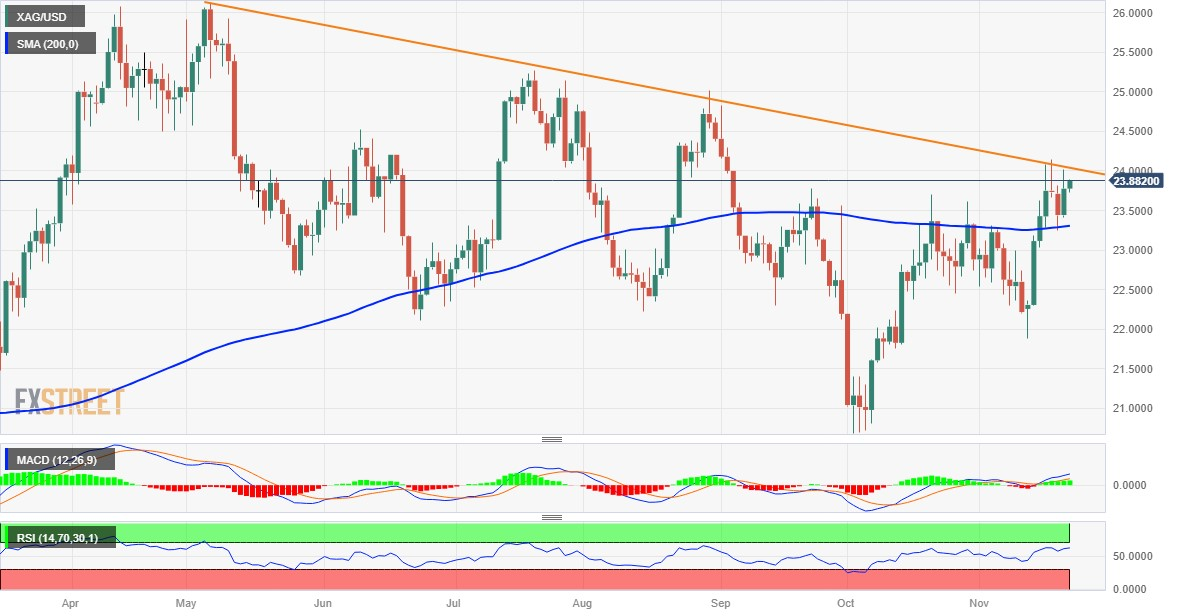
Silver Price Analysis: XAG/USD approaches descending trend-line hurdle near $24.00

  • Silver gains positive traction for the second straight day and trades closer to the weekly top.
  • The technical setup favours bulls and supports prospects for a further appreciating move.
  • Move beyond a multi-month-old descending trend line is needed to confirm the positive bias.

Silver (XAG/USD) attracts some buyers for the second successive day on Wednesday and sticks to its modest intraday gains through the early European session. The white metal, however, remains below the $24.00 mark, or the weekly high touched on Tuesday, which coincides with a downward-sloping trend line extending from the May swing high and should now act as a key pivotal point.

From a technical perspective, the recent breakout through the very important 200-day Simple Moving Average (SMA) barrier favours bullish traders. Moreover, oscillators on the daily chart are holding in the positive territory and are still far from being in the overbought zone. This, in turn, suggests that the path of least resistance for the XAG/USD is to the upside and supports prospects for a further appreciating move.

Bulls, however, need to wait for a move beyond the downward-sloping trend line resistance near the $24.00 mark before placing fresh bets. The XAG/USD might then surpass the $24.20-$24.25 intermediate hurdle and make a fresh attempt to conquer the $25.00 psychological mark. Some follow-through buying beyond the $25.15-$25.20 region will set the stage for a move towards reclaiming the $26.00 mark for the first time since May.

On the flip side, the 200-day SMA, currently pegged near the $23.30 region, might continue to protect the immediate downside. Any subsequent slide could attract fresh buyers and is more likely to remain limited near the $23.00 mark. A convincing break below the latter, however, might prompt aggressive technical selling and drag the XAG/USD further towards the $22.35-$22.30 zone en route to the $22.00 mark.

Silver daily chart

fxsoriginal

Technical levels to watch

XAG/USD

Overview
Today last price23.86
Today Daily Change0.08
Today Daily Change %0.34
Today daily open23.78
 
Trends
Daily SMA2023.02
Daily SMA5022.71
Daily SMA10023.23
Daily SMA20023.3
 
Levels
Previous Daily High24.02
Previous Daily Low23.41
Previous Weekly High24.15
Previous Weekly Low21.88
Previous Monthly High23.7
Previous Monthly Low20.68
Daily Fibonacci 38.2%23.79
Daily Fibonacci 61.8%23.64
Daily Pivot Point S123.45
Daily Pivot Point S223.12
Daily Pivot Point S322.84
Daily Pivot Point R124.06
Daily Pivot Point R224.35
Daily Pivot Point R324.67

Author

Haresh Menghani

Haresh Menghani is a detail-oriented professional with 10+ years of extensive experience in analysing the global financial markets.

More from Haresh Menghani
Share:

Markets move fast. We move first.

Orange Juice Newsletter brings you expert driven insights - not headlines. Every day on your inbox.

By subscribing you agree to our Terms and conditions.

Editor's Picks

EUR/USD bounces toward 1.1750 as US Dollar loses strength

EUR/USD returned to the 1.1750 price zone in the American session on Friday, despite falling Wall Street, which indicates risk aversion. Trading conditions remain thin following the New Year holiday and ahead of the weekend, with the focus shifting to US employment and European data scheduled for next week.

GBP/USD nears 1.3500, holds within familiar levels

After testing 1.3400 on the last day of 2025, GBP/USD managed to stage a rebound. Nevertheless, the pair finds it difficult to gather momentum and trades with modest intraday gains at around 1.3490 as market participants remain in holiday mood.

Gold trims intraday gains, approaches $4,300

Gold retreated sharply from the $4,400  area and trades flat for the day in the $4,320 price zone. Choppy trading conditions exacerbated the intraday decline, although XAU/USD bearish case is out of the picture, considering growing expectations for a dovish Fed and persistent geopolitical tensions.

Cardano gains early New Year momentum, bulls target falling wedge breakout

Cardano kicks off the New Year on a positive note and is extending gains, trading above $0.36 at the time of writing on Friday. Improving on-chain and derivatives data point to growing bullish interest, while the technical outlook keeps an upside breakout in focus.

Economic outlook 2026-2027 in advanced countries: Solidity test

After a year marked by global economic resilience and ending on a note of optimism, 2026 looks promising and could be a year of solid economic performance. In our baseline scenario, we expect most of the supportive factors at work in 2025 to continue to play a role in 2026.

Crypto market outlook for 2026

Year 2025 was volatile, as crypto often is.  Among positive catalysts were favourable regulatory changes in the U.S., rise of Digital Asset Treasuries (DAT), adoption of AI and tokenization of Real-World-Assets (RWA).