|

Silver Price Analysis: Silver probably rising in C leg of Measured Move

  • Silver has broken out of the falling channel it was in and is rallying. 
  • It could be in the wave C of a Measured Move, indicating it has higher to go. 
  • Silver is probably in a short-term uptrend now, with the odds favoring more upside. 

Silver (XAG/USD)  has decisively broken out of the descending channel it was in during the second half of May and June. This is a bullish sign and suggests the pair is now in a short-term uptrend. Given that “the trend is your friend” the odds favor a continuation higher. 

Silver Daily Chart

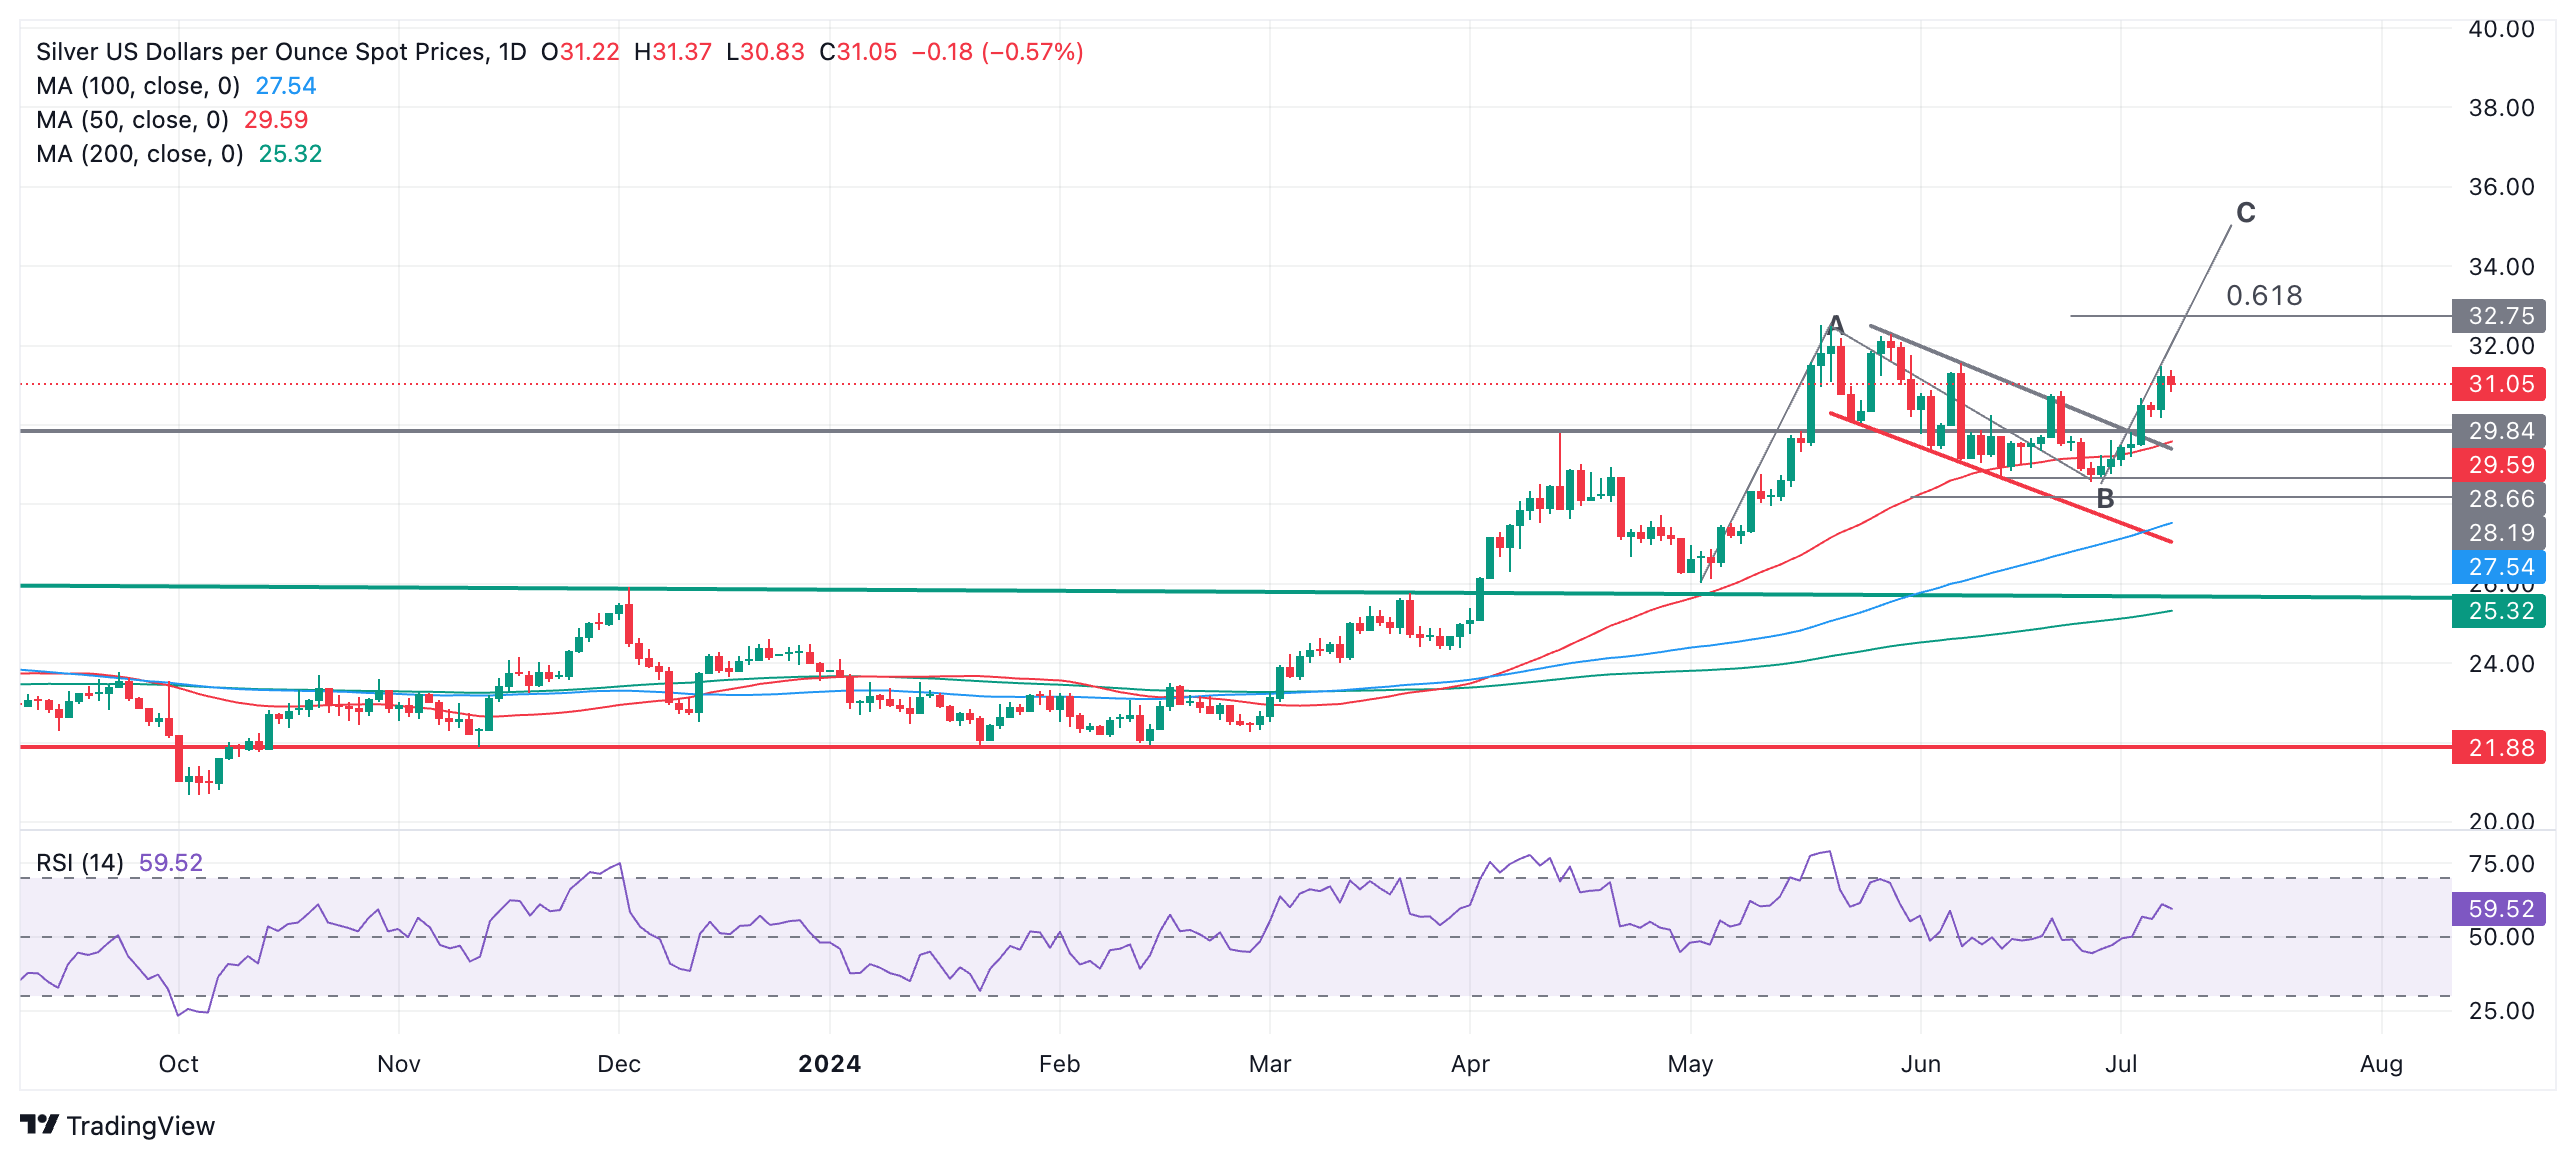
A further bullish sign is that Silver is probably forming a Measured Move (MM) price pattern. MMs are composed of three waves, sometimes labeled A,B and C; they resemble large zig-zags.  

Interpreted as an MM, the rally during the start of May could be considered its wave A, the whole of the falling channel its wave B, and the breakout from the channel, the start of wave C. 

As a minimum, wave C will probably reach the 0.618 extrapolation of wave A at $32.75. If wave C is the same length as A – as is often the case – then it could reach $35.00. 

Silver has also now broken above a major resistance level at the top of a four-year consolidation zone, a further longer-term bullish indication. 

Author

Joaquin Monfort

Joaquin Monfort is a financial writer and analyst with over 10 years experience writing about financial markets and alt data. He holds a degree in Anthropology from London University and a Diploma in Technical analysis.

More from Joaquin Monfort
Share:

Editor's Picks

AUD/USD regains mild traction, falters near 0.7150

AUD/USD gathers some steam and manages to flirt with the 0.7150 level on Thursday. However, the pair has retraced some of Wednesday’s significant pullback due to renewed selling pressure on the Greenback and a slight improvement in risk sentiment following hopes of a deal in the Middle East. Wrapping up the Australian docket, the RBA’s Hauser will speak early on Friday.

USD/JPY trades below 160.00 intervention threshold; bullish bias intact

The USD/JPY pair attracts some sellers during the Asian session amid fears that authorities will step in again to prop up the Japanese Yen. Furthermore, the Israel-Lebanon truce prompts some profit-taking around the US Dollar and exerts downward pressure on the currency pair.

Gold puts its 200-day SMA to the test near $4,420

Gold keeps the bullish stance in place in the latter part of Thursday’s session, although a convincing break above the key $4,500 mark per troy ounce still remains elusive. The precious metal’s advance comes amid the resurgence of some selling interest around the Greenback, improving risk sentiment, and declining US Treasury yields across the board.

XRP plummets as ETF outflows, geopolitical tensions reinforce bearish outlook
Ripple (XRP) edges lower, trading around $1.15 at the time of writing on Thursday, its lowest price since February 6. The cross-border money remittance token is extending the sell-off for the fifth consecutive day, reflecting persistent headwinds from ongoing geopolitical tensions and investor uncertainty.
Nonfarm payrolls: Testing the limits of Fed policy patience

The upcoming nonfarm payrolls report for May will provide the final update on the US labor market before Kevin Warsh attends his first policy meeting as the new Fed Chair later this month.

Recession on paper: What really moves the Canadian Loonie now?

Statistics Canada handed the headline writers a gift and the analysts a headache. Real GDP shrank 0.1% on an annualized basis in the first quarter, and with the fourth quarter of 2025 revised down to a 1.0% contraction, that is two negative quarters in a row, the textbook definition of a technical recession and Canada's first since the pandemic.