Silver Price Analysis: $25.70-65 confluence is the next relevant target for XAG/USD bears


  • Silver added to the post-FOMC losses and dropped to fresh six-week lows on Thursday.
  • The technical set-up favours bearish traders and supports prospects for further losses.
  • Any attempted recovery move could now be seen as an opportunity for bearish traders.

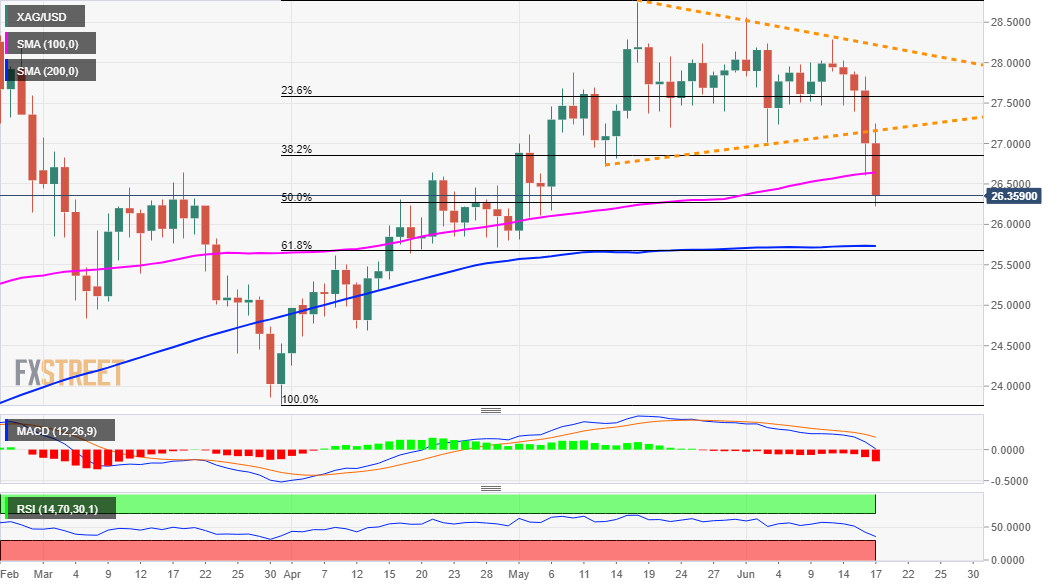
Silver failed to capitalize on its intraday positive move, instead came under some renewed selling pressure and extended its recent pullback from the $28.25-30 supply zone.

This marked the fifth consecutive day of a negative move and dragged the XAG/USD to its lowest level since May 6, around the $26.25-20 region during the mid-European session. The mentioned area coincides with the 50% Fibonacci level of the $23.78-$28.75 strong move up and should now act as a key pivotal point for short-term traders.

Meanwhile, the overnight post-FOMC fall confirmed a near-term bearish breakdown through a symmetrical triangle. A subsequent slide below 100-day SMA and bearish technical indicators on the daily chart adds credence to the negative outlook. This, in turn, supports prospects for an extension of the ongoing downward trajectory.

Hence, some follow-through slide below the $26.00 mark, towards testing the $25.70-65 confluence support, remains a distinct possibility. The latter comprises the very important 200-day SMA and the 61.8% Fibo. level. A convincing break below might now turn the XAG/USD vulnerable to challenge the key $25.00 psychological mark.

On the flip side, the $26.65 region (100-DMA), seems to act as immediate resistance. Any subsequent move up could now be seen as a selling opportunity near the $26.85 zone (38.2% Fibo. level). This is followed by the $27.00 mark and the triangle support breakpoint, around the $27.15 region, which should cap gains for the XAG/USD.

XAG/USD daily chart

fxsoriginal

Technical levels to watch

XAG/USD

Overview
Today last price 26.39
Today Daily Change -0.61
Today Daily Change % -2.26
Today daily open 27
 
Trends
Daily SMA20 27.78
Daily SMA50 27
Daily SMA100 26.63
Daily SMA200 25.74
 
Levels
Previous Daily High 27.83
Previous Daily Low 26.61
Previous Weekly High 28.29
Previous Weekly Low 27.47
Previous Monthly High 28.75
Previous Monthly Low 25.81
Daily Fibonacci 38.2% 27.08
Daily Fibonacci 61.8% 27.36
Daily Pivot Point S1 26.46
Daily Pivot Point S2 25.93
Daily Pivot Point S3 25.24
Daily Pivot Point R1 27.69
Daily Pivot Point R2 28.37
Daily Pivot Point R3 28.91


Share: Feed news

Information on these pages contains forward-looking statements that involve risks and uncertainties. Markets and instruments profiled on this page are for informational purposes only and should not in any way come across as a recommendation to buy or sell in these assets. You should do your own thorough research before making any investment decisions. FXStreet does not in any way guarantee that this information is free from mistakes, errors, or material misstatements. It also does not guarantee that this information is of a timely nature. Investing in Open Markets involves a great deal of risk, including the loss of all or a portion of your investment, as well as emotional distress. All risks, losses and costs associated with investing, including total loss of principal, are your responsibility. The views and opinions expressed in this article are those of the authors and do not necessarily reflect the official policy or position of FXStreet nor its advertisers. The author will not be held responsible for information that is found at the end of links posted on this page.

If not otherwise explicitly mentioned in the body of the article, at the time of writing, the author has no position in any stock mentioned in this article and no business relationship with any company mentioned. The author has not received compensation for writing this article, other than from FXStreet.

FXStreet and the author do not provide personalized recommendations. The author makes no representations as to the accuracy, completeness, or suitability of this information. FXStreet and the author will not be liable for any errors, omissions or any losses, injuries or damages arising from this information and its display or use. Errors and omissions excepted.

The author and FXStreet are not registered investment advisors and nothing in this article is intended to be investment advice.

Recommended content


Recommended content

Editors’ Picks

AUD/USD posts gain, yet dive below 0.6500 amid Aussie CPI, ahead of US GDP

AUD/USD posts gain, yet dive below 0.6500 amid Aussie CPI, ahead of US GDP

The Aussie Dollar finished Wednesday’s session with decent gains of 0.15% against the US Dollar, yet it retreated from weekly highs of 0.6529, which it hit after a hotter-than-expected inflation report. As the Asian session begins, the AUD/USD trades around 0.6495.

AUD/USD News

USD/JPY finds its highest bids since 1990, approaches 156.00

USD/JPY finds its highest bids since 1990, approaches 156.00

USD/JPY broke into its highest chart territory since June of 1990 on Wednesday, peaking near 155.40 for the first time in 34 years as the Japanese Yen continues to tumble across the broad FX market. 

USD/JPY News

Gold stays firm amid higher US yields as traders await US GDP data

Gold stays firm amid higher US yields as traders await US GDP data

Gold recovers from recent losses, buoyed by market interest despite a stronger US Dollar and higher US Treasury yields. De-escalation of Middle East tensions contributed to increased market stability, denting the appetite for Gold buying.

Gold News

Ethereum suffers slight pullback, Hong Kong spot ETH ETFs to begin trading on April 30

Ethereum suffers slight pullback, Hong Kong spot ETH ETFs to begin trading on April 30

Ethereum suffered a brief decline on Wednesday afternoon despite increased accumulation from whales. This follows Ethereum restaking protocol Renzo restaked ETH crashing from its 1:1 peg with ETH and increased activities surrounding spot Ethereum ETFs.

Read more

Dow Jones Industrial Average hesitates on Wednesday as markets wait for key US data

Dow Jones Industrial Average hesitates on Wednesday as markets wait for key US data

The DJIA stumbled on Wednesday, falling from recent highs near 38,550.00 as investors ease off of Tuesday’s risk appetite. The index recovered as US data continues to vex financial markets that remain overwhelmingly focused on rate cuts from the US Fed.

Read more

Forex MAJORS

Cryptocurrencies

Signatures