Siemens (SIE Stock) completes wave 3 and builds ABC pullback
-
Siemens (SIE) stock price made a bearish dip yesterday. This created a breakout below the 21 ema zone after breaking the support trend line (dotted green) already earlier.
-
Does this mean that the uptrend is over? Let’s review the moving averages, Fibonacci level, and price patterns.
-
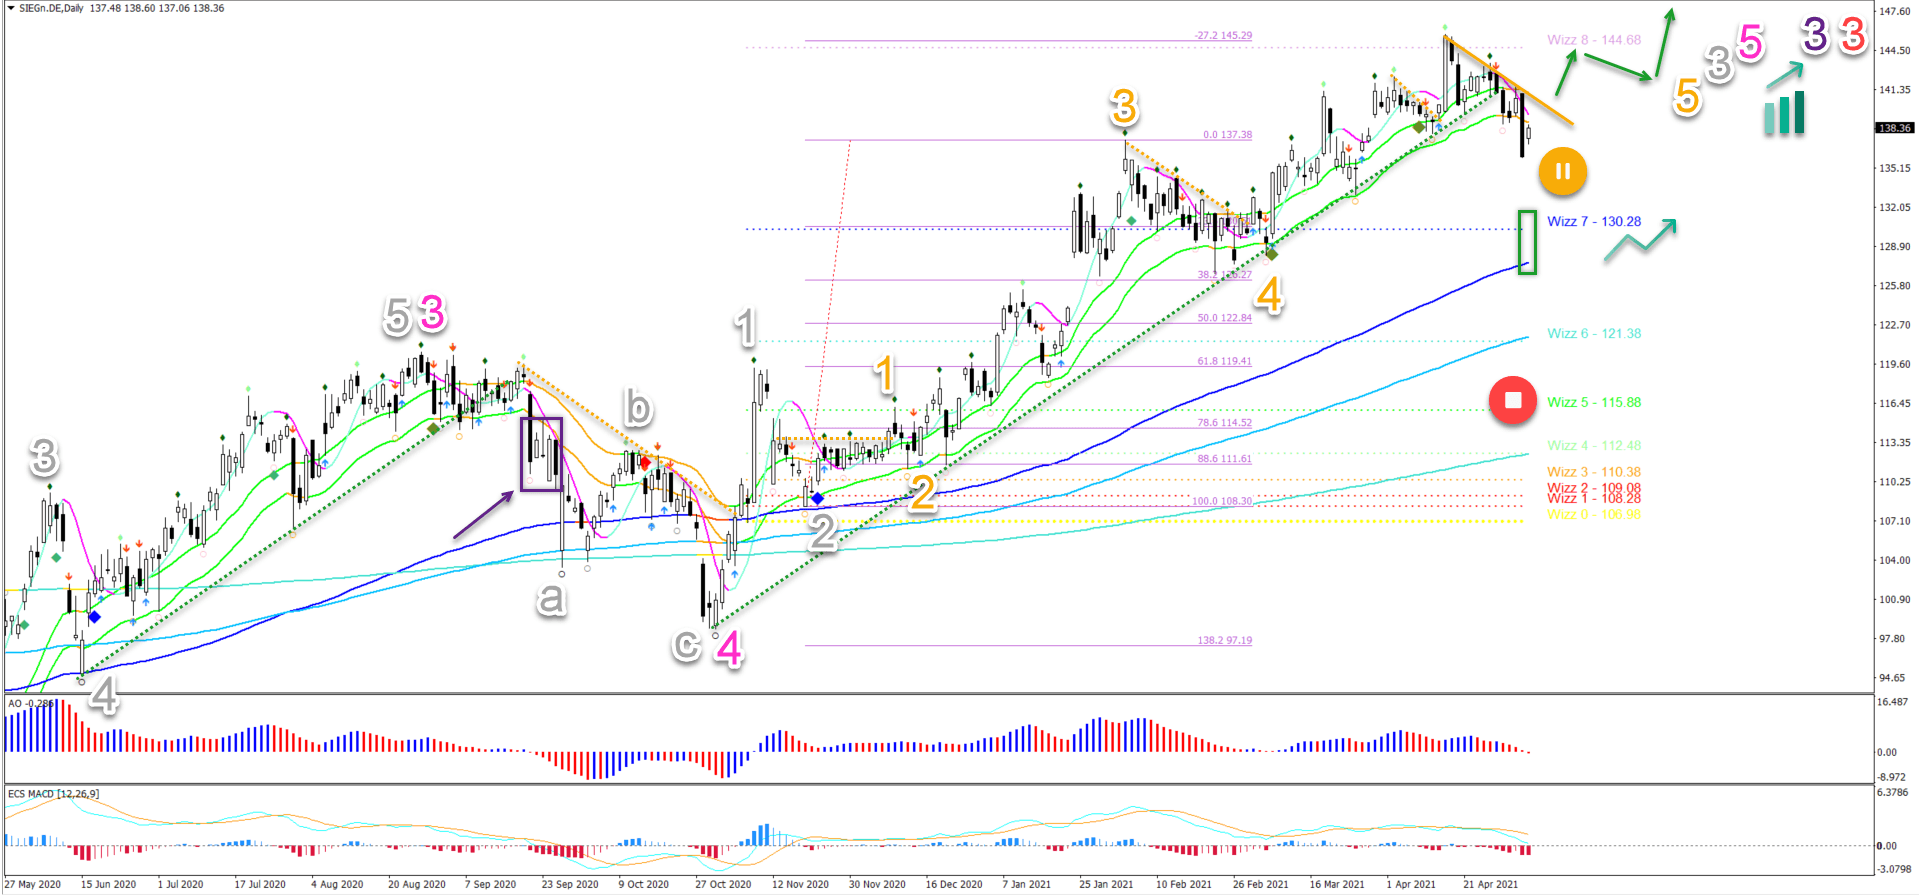
The Siemens daily chart is from a long-term picture still clearly in an uptrend. The 21 emas are above all of the long-term moving averages with lots of space in between them.

Price charts and technical analysis
The Siemens daily chart is from a long-term picture still clearly in an uptrend. The 21 emas are above all of the long-term moving averages with lots of space in between them. That said, a bearish breakout could be a first signal of an upcoming reversal:
-
If price action remains below the 21 ema zone as traders saw on the left side of the chart (purple box & arrow), then a bearish pullback or reversal is becoming more likely.
-
A break below yesterday’s daily candle low confirms a pullback (orange circle).
-
In that case, price action has probably completed the wave 5 (orange) of wave 3 (grey) and a wave 4 (grey) could emerge. Price is likely to move back towards the 144 ema.
-
If price action goes back into the 21 ema zone or breaks above the 21 emas and the resistance trend line (orange) then a bullish trend continuation is expected (green arrows).
-
The main targets are located $150, $155, and $168.
-
The higher high should complete a wave 3 (grey) of wave 5 (pink).
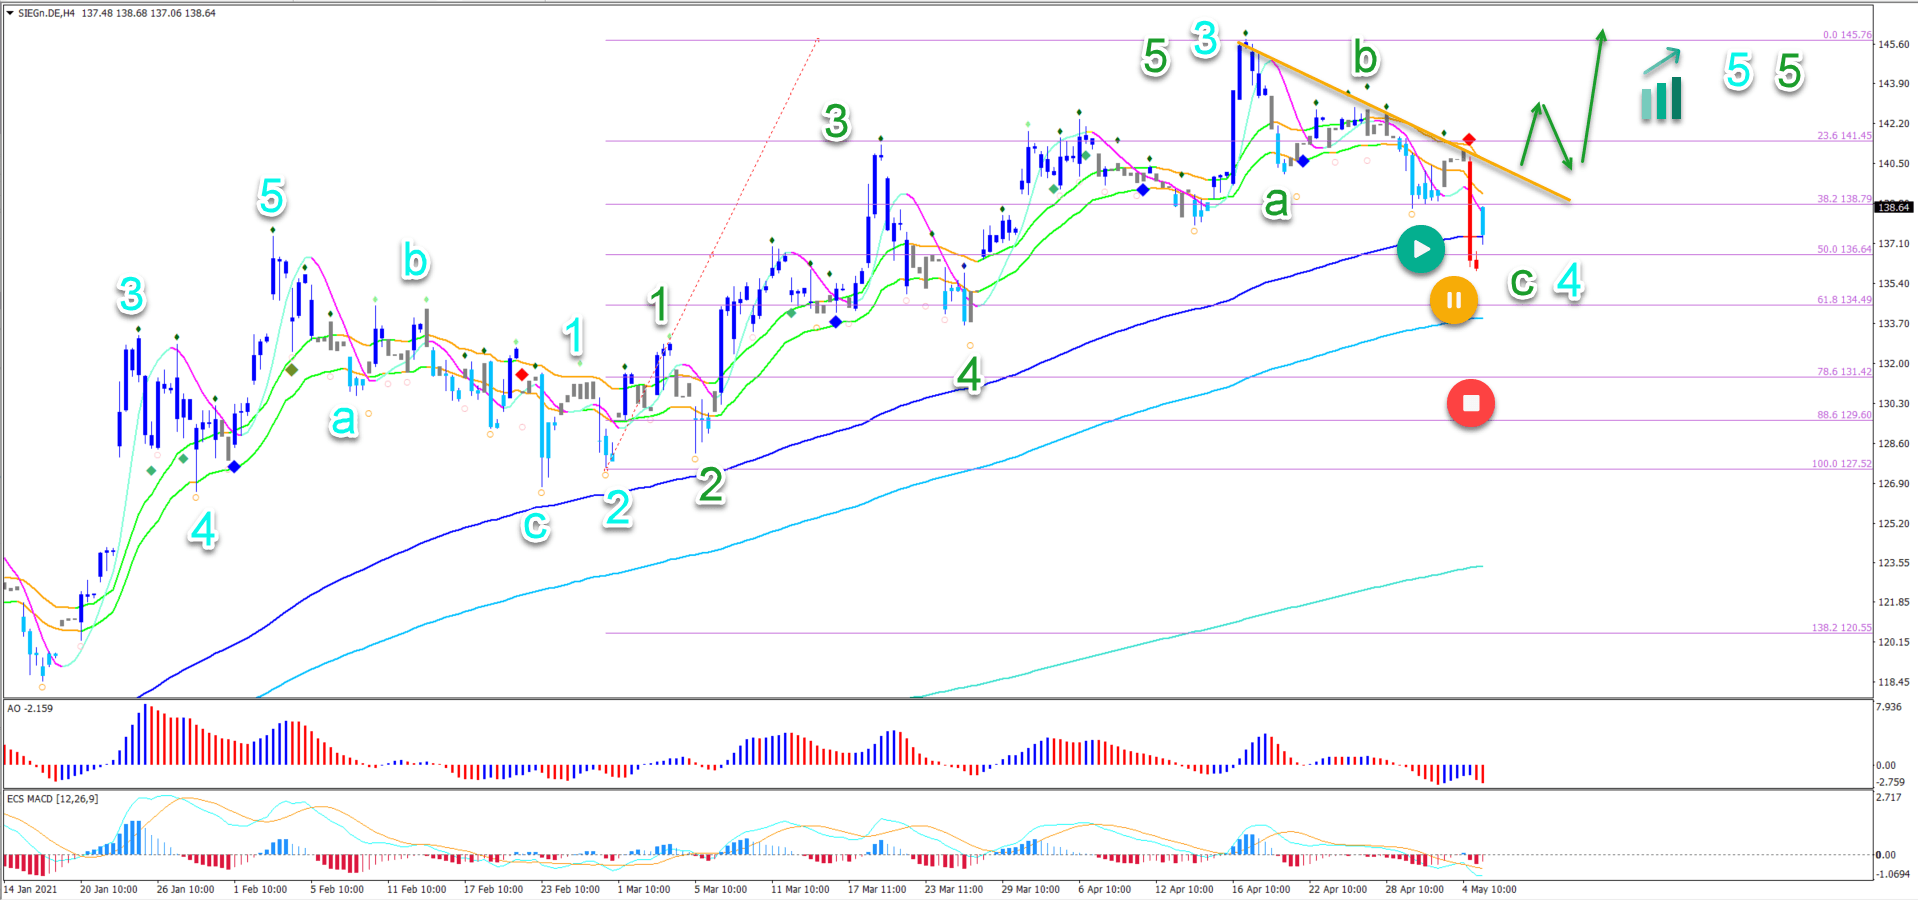
On the 4 hour chart, we can see that price action did complete a wave 4 (green) as mentioned in our previous Siemens analysis:
-
After price action completed the wave 5 (green) in wave 3 (light blue), a bearish ABC pullback (green) seems to be taking place in wave 4 (light blue).
-
Price action retraced strongly which created a first red SWAT candle. However, price action is still at the 50% Fibonacci retracement level, which is a key support zone.
-
A bullish bounce and breakout above the resistance trend line (orange) and 21 emas could confirm the end of the wave 4 (light blue) and the start of the wave 5 (light blue).
-
A break below the 50% Fib however places this bullish wave analysis in doubt (orange) circle) and a deep retracement invalidates it (red circle).
The analysis has been done with the ecs.SWAT method and ebook.
Premium
You have reached your limit of 3 free articles for this month.
Start your subscription and get access to all our original articles.
Author

Chris Svorcik
Elite CurrenSea
Experience Chris Svorcik has co-founded Elite CurrenSea in 2014 together with Nenad Kerkez, aka Tarantula FX. Chris is a technical analyst, wave analyst, trader, writer, educator, webinar speaker, and seminar speaker of the financial markets.


