Shanghai Composite Index Elliott Wave technical analysis [Video]
![Shanghai Composite Index Elliott Wave technical analysis [Video]](https://editorial.fxsstatic.com/images/i/General-Stocks_1_XtraLarge.png)
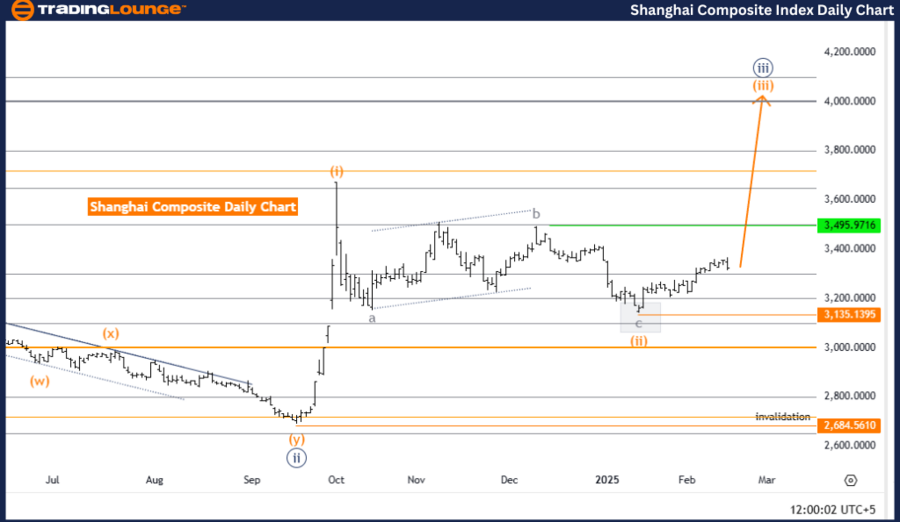
Shanghai Composite Elliott Wave Analysis – Trading Lounge Day chart.
Shanghai Composite Elliott Wave technical analysis
-
Function: Bullish Trend.
-
Mode: Impulsive.
-
Structure: Orange Wave 3.
-
Position: Navy Blue Wave 3.
-
Direction (next higher degree): Orange Wave 3 (Started).
-
Wave invalidation level: 2684.5610.
Analysis overview
The Shanghai Composite Elliott Wave Analysis for the daily chart confirms a bullish trend. The market is currently in an impulsive phase, reflecting strong upward momentum.
The wave structure is identified as Orange Wave 3, which forms part of a larger Navy Blue Wave 3, suggesting that the market is in a significant upward movement phase, with Orange Wave 3 driving prices higher.
Wave structure breakdown
-
Orange Wave 2, a corrective phase within the broader wave structure, appears completed, leading to the development of Orange Wave 3.
-
Orange Wave 3 is expected to push prices further upward.
-
The next higher-degree wave remains Orange Wave 3, confirming bullish momentum is likely to persist.
Key level to watch
-
Wave Cancellation Invalidation Level: 2684.5610.
-
This threshold is critical—if the price falls below 2684.5610, the current wave count is invalidated, potentially altering the bullish outlook.
Traders should monitor this level closely to confirm the validity of the ongoing bullish trend.
Conclusion
The Shanghai Composite daily chart analysis indicates a bullish trend with strong impulsive momentum.
-
The market is currently in Orange Wave 3 of Navy Blue Wave 3, signaling further upside potential.
-
The completion of Orange Wave 2 has set the stage for continued upward movement.
-
The invalid level at 2684.5610 acts as a crucial marker for the continuation or potential reversal of the bullish trend.
-
The next phase, Orange Wave 3, is expected to drive the price higher, reinforcing bullish sentiment in the market.
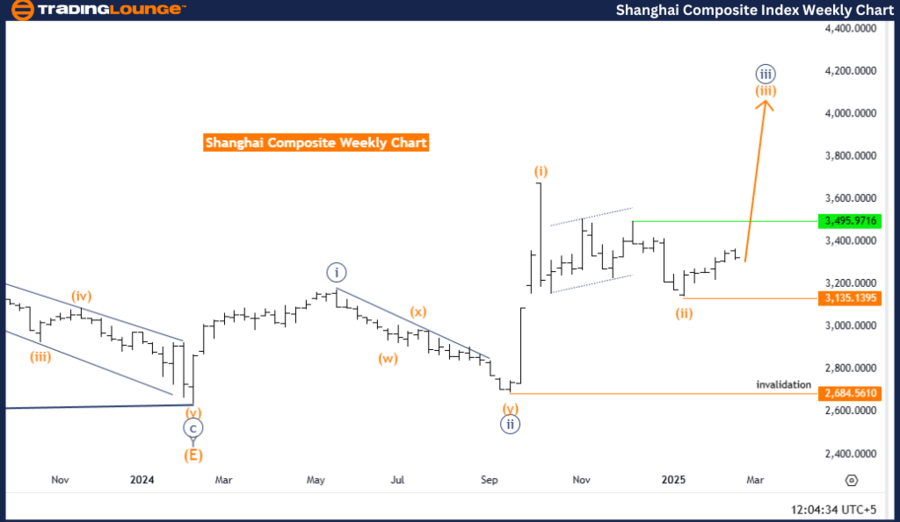
Shanghai Composite Elliott Wave Analysis – Trading Lounge weekly chart.
Shanghai Composite Elliott Wave technical analysis
-
Function: Bullish Trend.
-
Mode: Impulsive.
-
Structure: Orange Wave 3.
-
Position: Navy Blue Wave 3.
-
Direction (next higher degree): Orange Wave 3 (Started).
-
Wave invalidation level: 2684.5610.
Analysis overview
The Shanghai Composite Weekly Chart Analysis confirms a bullish trend with an impulsive wave structure. The market is currently in Orange Wave 3, suggesting continued upward momentum and strong growth potential.
The completion of Orange Wave 2 marks the transition into Orange Wave 3, reinforcing the bullish trend and signaling potential price increases as the market progresses.
Wave structure breakdown
-
Orange Wave 2 has completed, confirming the transition into Orange Wave 3.
-
Orange Wave 3 is currently active, indicating the continuation of an uptrend.
-
The next higher-degree wave remains Orange Wave 3, supporting further bullish movement in the coming weeks.
Key level to watch
- Wave Cancellation Invalidation Level: 2684.5610
- If the price drops below this level, the current wave count would be invalidated, potentially altering the bullish outlook.
Traders should monitor this level closely to confirm the validity of the ongoing bullish trend.
Conclusion
The Shanghai Composite Weekly Chart Analysis presents a strong bullish outlook, with Orange Wave 3 actively developing.
-
The completion of Orange Wave 2 has signaled the beginning of a new upward phase.
-
The current wave structure supports further price increases as long as the bullish trend remains intact.
-
The invalid level at 2684.5610 serves as a critical threshold—a break below this point could indicate a shift in market direction.
Shanghai Composite Index Elliott Wave technical analysis [Video]
Author

Peter Mathers
TradingLounge
Peter Mathers started actively trading in 1982. He began his career at Hoei and Shoin, a Japanese futures trading company.


