Scentre Group Elliott Wave technical forecast [Video]
![Scentre Group Elliott Wave technical forecast [Video]](https://editorial.fxstreet.com/images/TechnicalAnalysis/ChartPatterns/Candlesticks/candlestick-chart-of-a-company-with-pen-18674643_XtraLarge.jpg)
ASX: SCG Elliott Wave technical analysis
Greetings, Our Elliott Wave analysis today updates the Australian Stock Exchange (ASX) with SCENTRE GROUP – SCG. We are seeing a potential bull market with wave 3-grey of SCG.ASX, but it needs a little more time.
ASX: SCG one-day chart (semilog scale) analysis
Function: Major trend (Intermediate degree, orange).
Mode: Motive.
Structure: Impulse.
Position: Wave 2-grey of Wave (3)-orange.
Details: Wave 1-grey just finished, and wave 2-grey is unfolding to push lower, it could target around 3.40 – 3.28. If the 2-grey wave continues to push lower than the 3.14 level, it will call for a re-evaluation of the entire situation. Conversely, when the price pushes higher than the end of the ((b))-navy wave, it will suggest that the 3-grey wave is unfolding.
Invalidation point: 3.14.

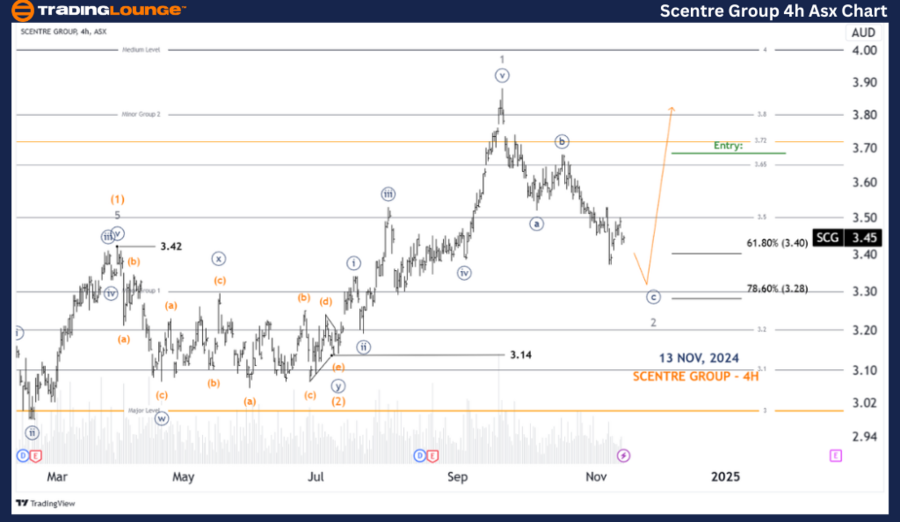
ASX: SCG four-hour chart analysis
Function: Major trend (Minute degree, navy).
Mode: Motive.
Structure: Impulse.
Position: Wave ((c))-navy of Wave 2-grey.
Details: Wave 1-grey has ended, and wave 2-grey is unfolding as a Zigzag labeled ((a))((b))((c))-navy. Now wave ((c))-navy is continuing its work to push lower, if price breaks 3.28 it will show that the Bear market weight is increasing, and I will review the situation then. Pushing above the end of wave ((B))-navy shows that wave 3-grey is ready to unfold.
Invalidation point: 3.14.
Conclusion
Our analysis, forecast of contextual trends, and short-term outlook for ASX: SCENTRE GROUP – SCG aim to provide readers with insights into the current market trends and how to capitalize on them effectively. We offer specific price points that act as validation or invalidation signals for our wave count, enhancing the confidence in our perspective. By combining these factors, we strive to offer readers the most objective and professional perspective on market trends.
Scentre Group Elliott Wave technical forecast [Video]
Author

Peter Mathers
TradingLounge
Peter Mathers started actively trading in 1982. He began his career at Hoei and Shoin, a Japanese futures trading company.


