|

Santos Limited Elliott Wave technical forecast [Video]

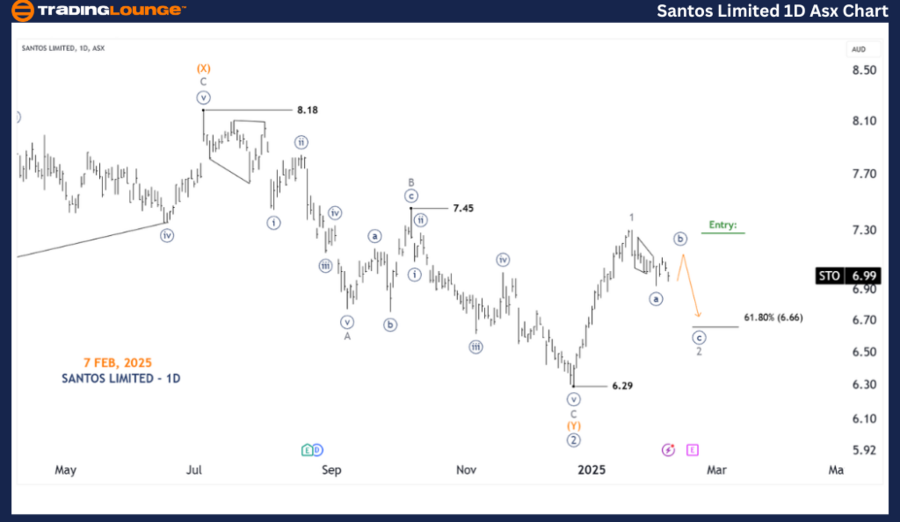
STO Elliott Wave technical analysis (one-day chart)

Function: Major Trend (Minor Degree, Gray).

Mode: Motive.

Structure: Impulse.

Position: Wave ((3)) - Navy.

Details:

  • Wave ((2)) - Navy has possibly completed, and wave ((3)) - Navy is now pushing higher.

  • This is an extended wave, and a pullback with wave 2 - Gray might be necessary before the trend resumes upward.

  • Quality long trade setups may emerge once the price surpasses the wave 1 - Gray endpoint, which is also the key point for trend confirmation.

Invalidation Point: 6.29.

Key point: End of Wave 1 - Gray.

Santos

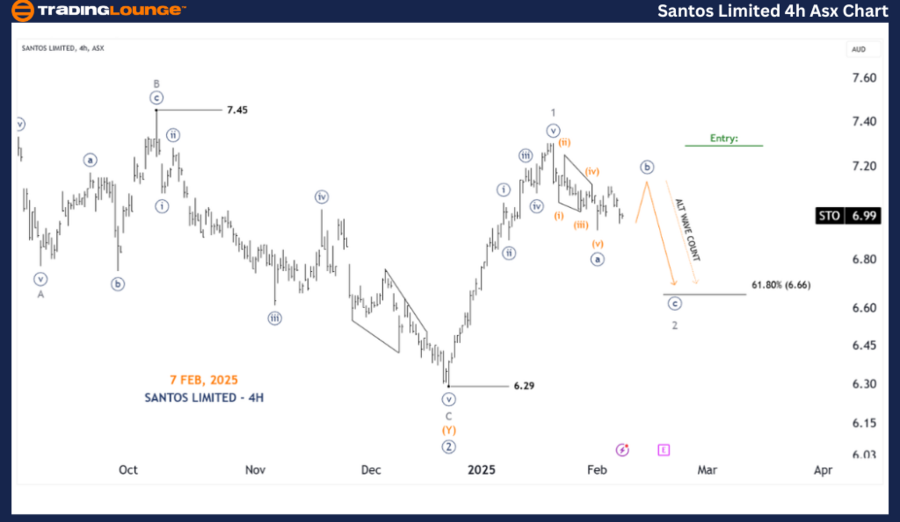
STO Elliott Wave technical analysis (four-hour chart)

Function: Major Trend (Minor Degree, Gray).

Mode: Motive.

Structure: Impulse.

Position: Wave (ii) - Orange of Wave ((iii)) - Navy.

Details:

  • Wave 1 - Gray has completed as a five-wave structure, and wave 2 - Gray appears to be developing as a zigzag correction, potentially pushing prices slightly lower.

  • The ideal target for correction is around 6.66 before price moves back up.

  • If price surpasses the end of wave 1, it would confirm a bullish trend resumption.

Invalidation point: 6.29.

Key point: End of Wave 1 - Gray.

Chart

Conclusion

Our Elliott Wave analysis and forecast for SANTOS LIMITED - STO provide insights into the current market trend and trading opportunities. By highlighting key price points, we identify validation and invalidation signals, enhancing confidence in our market perspective. This structured approach helps traders make well-informed decisions.

Santos Limited Elliott Wave technical forecast [Video]

Author

Peter Mathers

Peter Mathers

TradingLounge

Peter Mathers started actively trading in 1982. He began his career at Hoei and Shoin, a Japanese futures trading company.

More from Peter Mathers
Share:

Editor's Picks

EUR/USD holds lower ground near 1.1850 ahead of EU/ US data

EUR/USD remains in the negative territory for the fourth successive session, trading around 1.1850 in European trading on Friday. A broadly cautious market environment paired with modest US Dollar demand undermines the pair ahead of the Eurozone GDP second estimate and the critical US CPI data. 

GBP/USD keeps losses around 1.3600, awaits US CPI for fresh impetus

GBP/USD holds moderate losses at around 1.3600 in the European session on Friday, though it lacks bearish conviction. The US Dollar remains supported amid softer risk tone and ahead of the US consumer inflation figures due later in the NA session on Friday. 

Gold trims intraday gains to $5,000 as US inflation data loom

Gold retreats from the vicinity of the $5,000 psychological mark, though sticks to its modest intraday gains heading into the European session. Traders now look forward to the release of the US consumer inflation figures for more cues about the Fed policy path. The outlook will play a key role in influencing the near-term US Dollar price dynamics and provide some meaningful impetus to the non-yielding bullion.

US CPI data set to show modest inflation cooling as markets price in a more hawkish Fed

The US Bureau of Labor Statistics will publish January’s Consumer Price Index data on Friday, delayed by the brief and partial United States government shutdown. The report is expected to show that inflationary pressures eased modestly but also remained above the Federal Reserve’s 2% target.

A tale of two labour markets: Headline strength masks underlying weakness

Undoubtedly, yesterday’s delayed US January jobs report delivered a strong headline – one that surpassed most estimates. However, optimism quickly faded amid sobering benchmark revisions.

Solana Price Forecast: Mixed market sentiment caps recovery

Solana (SOL) is trading at $79 as of Friday, following a correction of over 9% so far this week. On-chain and derivatives data indicates mixed sentiment among traders, further limiting the chances of a price recovery.