Relief rally as a bull trap? Bottoming or more weakness to come [Video]
![Relief rally as a bull trap? Bottoming or more weakness to come [Video]](https://editorial.fxsstatic.com/images/i/General-Stocks_1_XtraLarge.png)
Watch the video from the WLGC session on 18 Mar 2025 to find out the following:
-
How the violation of the 200 Day Moving Average (DMA) could affect the relief rally.
-
The strategy to buy stock in this current volatile market environment.
-
The analogue comparison to judge the strength in the market and what to anticipate next.
Market environment
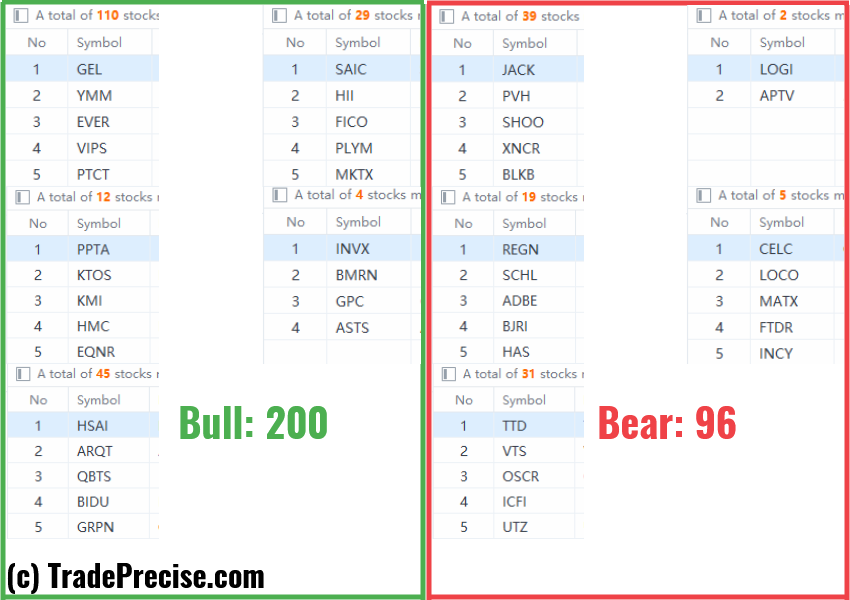
The bullish vs. bearish setup is 200 to 96 from the screenshot of my stock screener below.
Three stocks ready to soar
15 actionable setups such as BABA, ALHC, ICE were discussed during the live session before the market open (BMO).
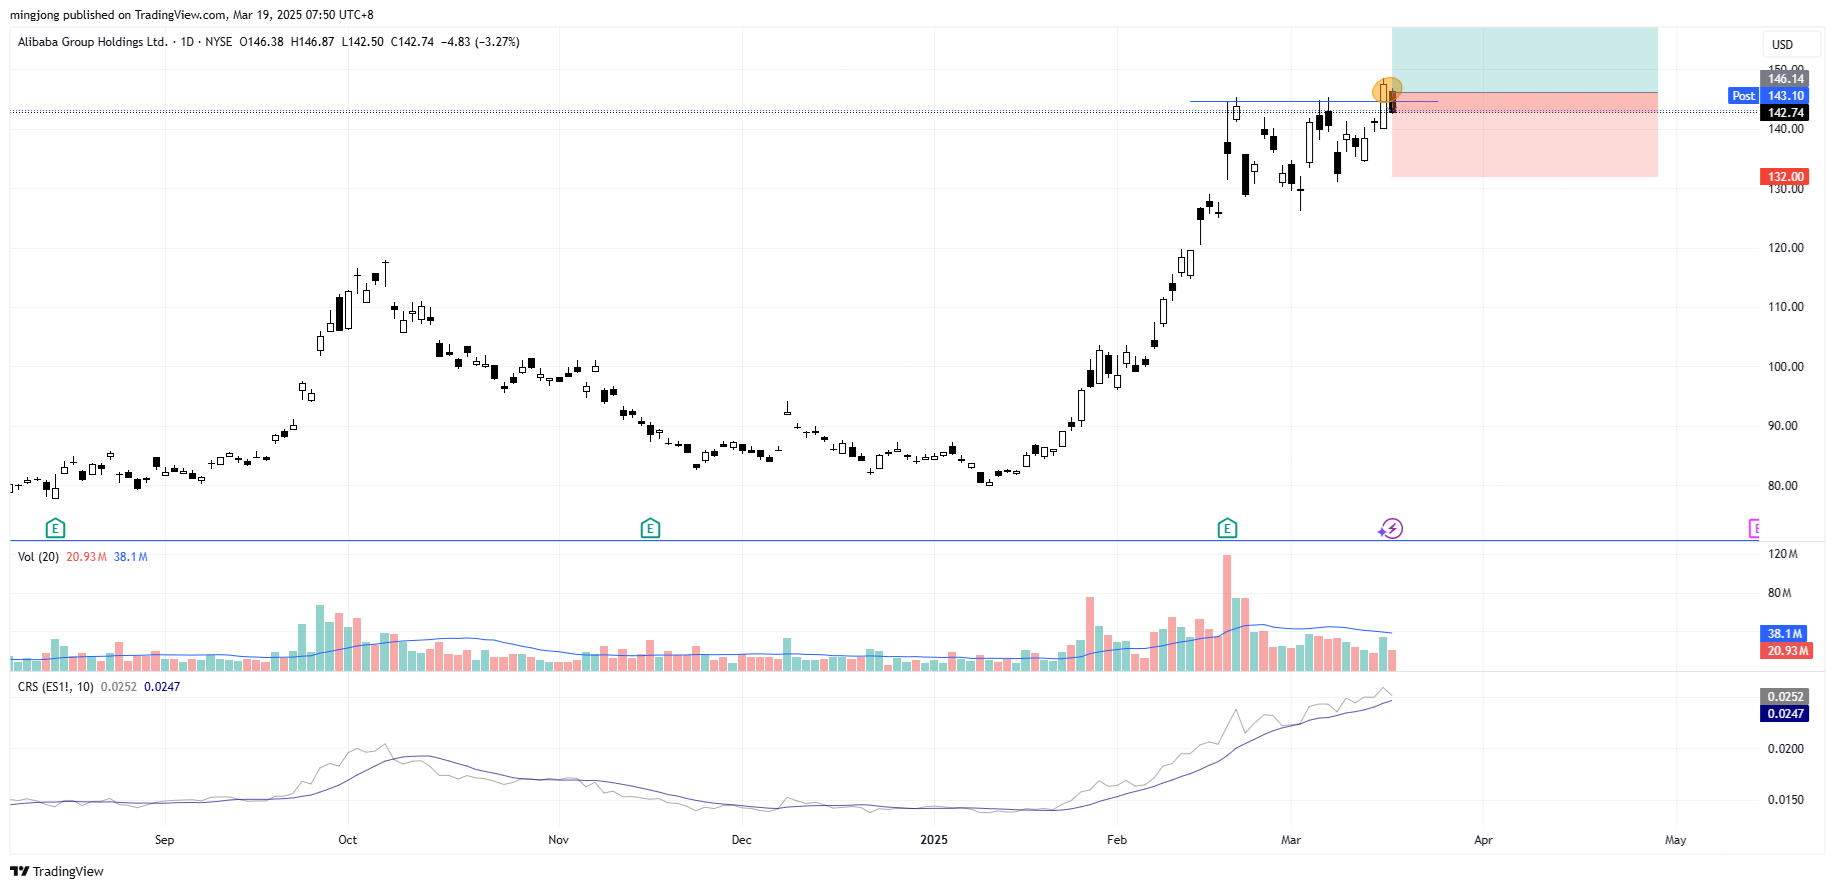
Alibaba Group Holdings (BABA)
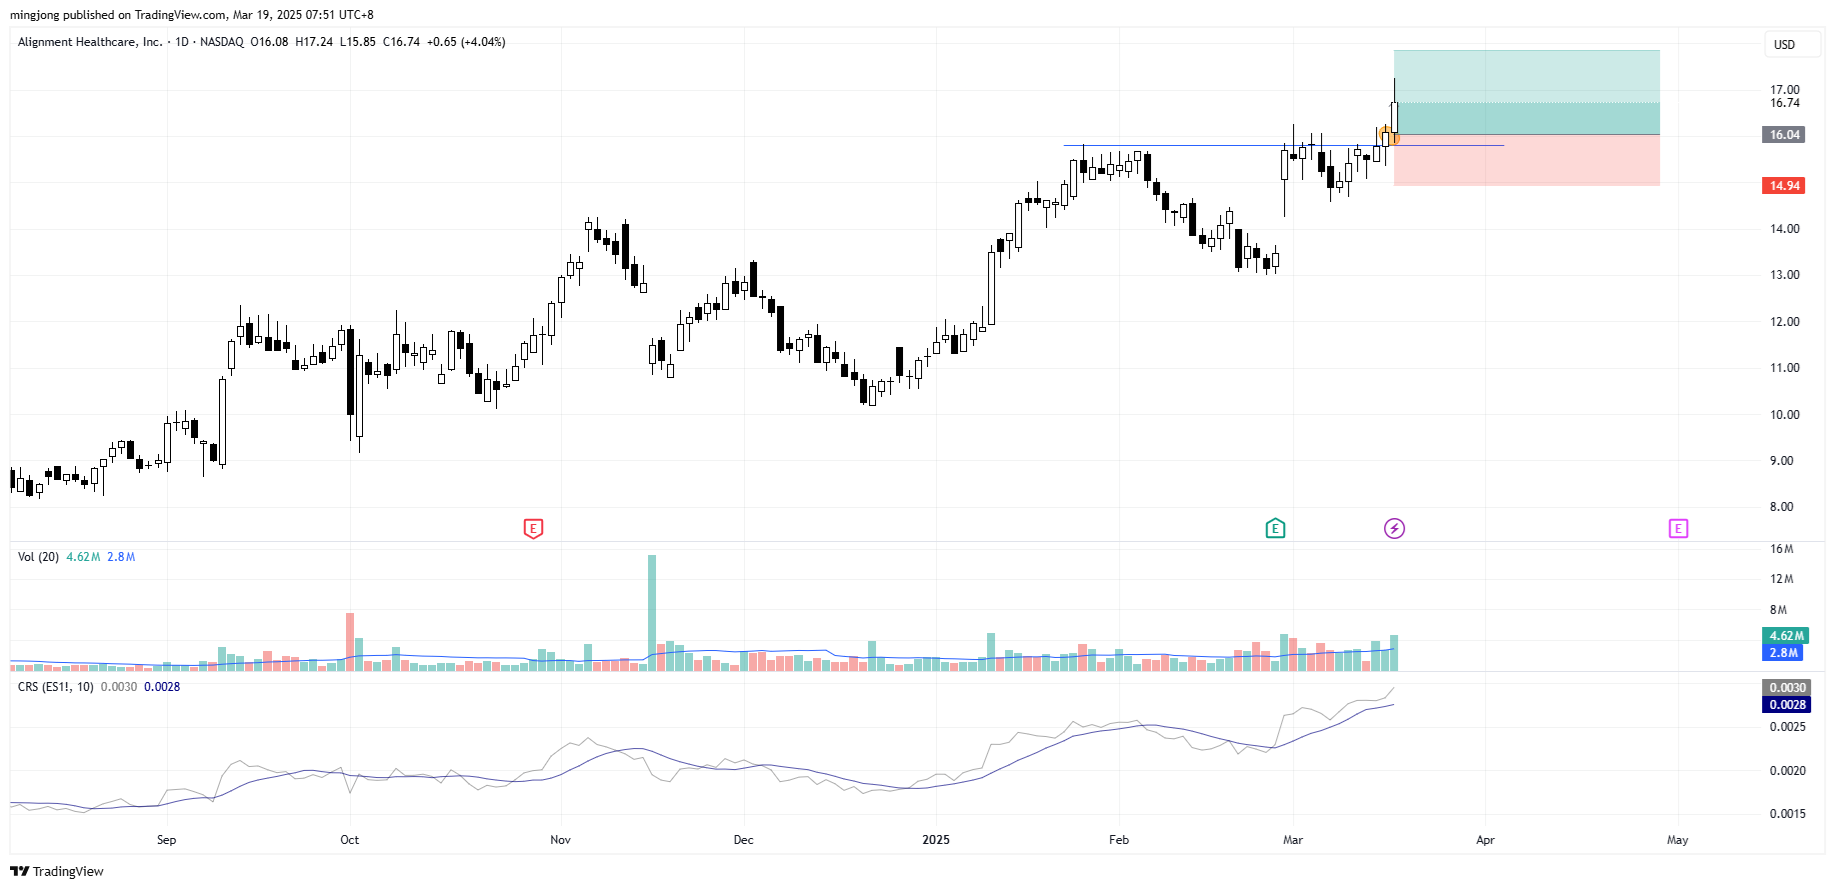
Alignment Healthcare (ALHC)
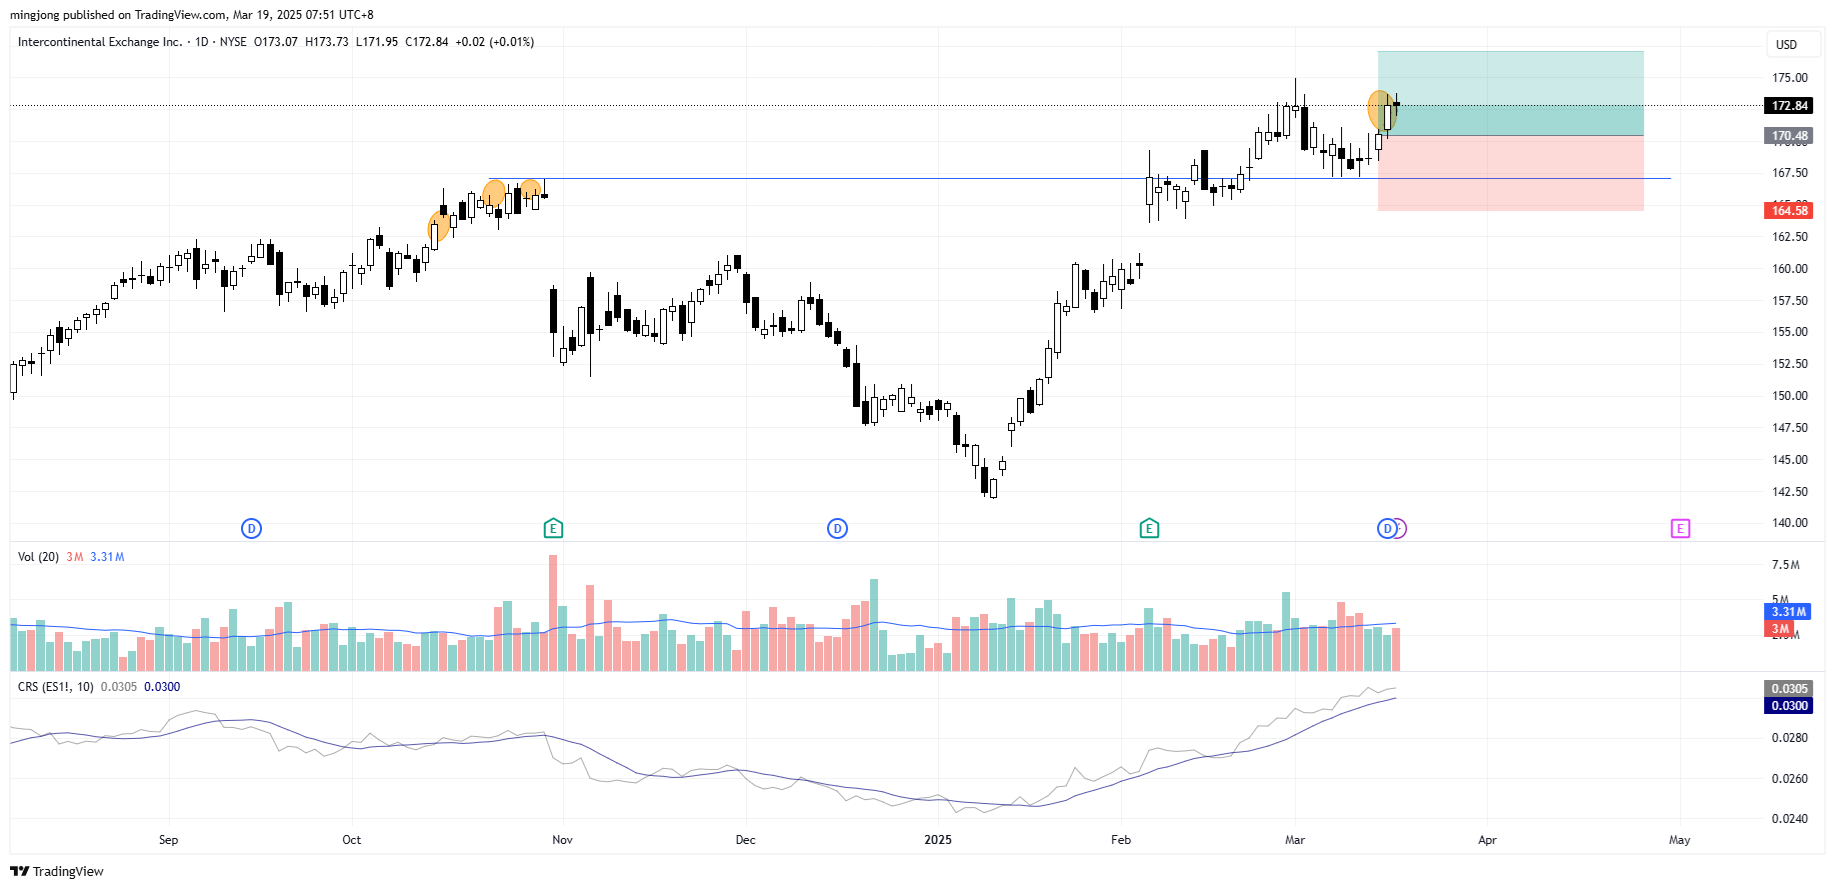
Intercontinental Exchange (ICE)
Author

Ming Jong Tey
Independent Analyst
Ming Jong Tey has been trading since 2008. He started his learning journey from technical analysis (indicators, Fibonacci, etc...) to value investing. Throughout his journey, he develops an interest in price action with chart pattern trading.


