Ready for the Qualcomm (QCOM) bull run in 2023? Here’s what to expect [Video]
![Ready for the Qualcomm (QCOM) bull run in 2023? Here’s what to expect [Video]](https://editorial.fxstreet.com/images/TechnicalAnalysis/ChartPatterns/PointFigure/stock-market-performance-9668321.jpg)
Qualcomm Inc (QCOM) is a semiconductor company that designs and manufactures integrated circuits and system software for wireless products. It pioneered Code Division Multiple Access (CDMA) technology and holds various patents related to 5G, 4G, CDMA2000, TD-SCDMA and WCDMA wireless communication standards. QCOM is listed on NASDAQ and is a component of Nasdaq 100 and S&P 500 under Information Technology.
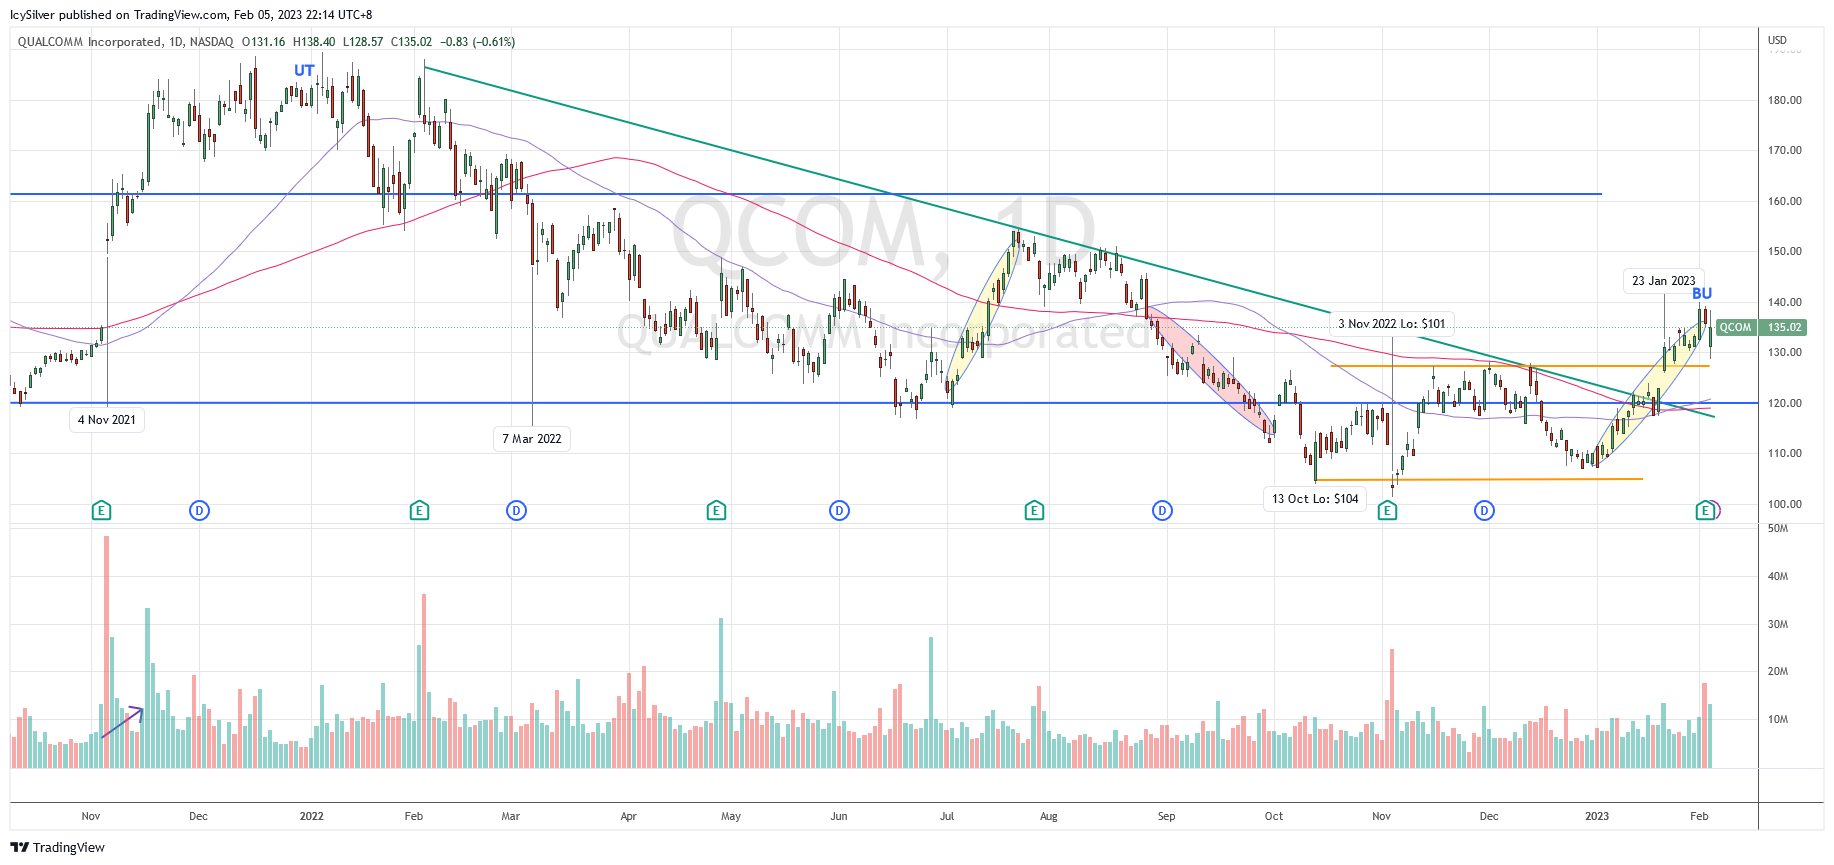
QCOM has been moving in a wide range between $120 and $160 since it was defined in early March 2021. There was a climatic run up in Nov 2021 with a spike in volume. However, the price was unable to commit above $160 and formed a Wyckoff upthrust (UT). It then retraced back into the range in early March 2022.
The price drifted down gradually to retest the low of the range around $120 with increase of volume suggested supply absorption. Unfortunately, the inability to rally up during July suggested more weakness ahead. This was confirmed by a Wyckoff sign of weakness (SOW) and broke below $120 in early October.
The down trend finally halted around $104 on 13 Oct and became a new narrow trading range between $104 and $127. The low volume in this narrow trading range together with no follow through to the downside could signal a potential Wyckoff spring in a trading range. The price began a Wyckoff sign of strength (SOS) rally at the start of 2023. On 23 Jan 2023, the price broke above $127 for the first time and stayed committed above it. QCOM is now in Wyckoff backup (BU).
Bias
Bullish. According to the Wyckoff method, QCOM has just broken out from a 3-month accumulation phase and is now in BU. It is more than likely to rally up to the first target of $150 followed by $161, as part of the sign of strength rally within a long term accumulation structure.
If the price breaks below $127, it is likely to retest the long term support of $120.
QCOM was discussed in detail in my weekly live group coaching on 24 Jan 2023 before the market opened. The improving market breadth together with many bullish trade entry setups could suggest a new bull run as discussed in the video below.
Author

Ming Jong Tey
Independent Analyst
Ming Jong Tey has been trading since 2008. He started his learning journey from technical analysis (indicators, Fibonacci, etc...) to value investing. Throughout his journey, he develops an interest in price action with chart pattern trading.
















