Questions about the fear of 20% S&P 500 corrections

A funny thing happened on Friday, May 20 – the “Fear of 20” kicked in once again. The S&P closed the day before at 3,900.79, down 18.7% from its peak close on January 3, 2022 (at 4,796.56). On Friday, May 20, the S&P 500 opened down sharply (-2.3%) to 3,810, which marked a 20.56% decline from its peak, the definition of a “bear market,” a 20+% decline – on a closing basis (not intra-day) – on the S&P 500.
Surviving the curse of the 20% S&P 500 correction
Traders must have looked at each other and said, “Not on my watch!” The market turned on a dime, and it closed up a fraction of a point, at 3,901.36, so we survived the “curse of the 20% S&P 500 correction” once again. (All in all, the S&P 500 flirted with a 19% to 20% decline on four days – May 12th, 19th, 20th, and 24th.)
Ironically, the Super-bear Jeremy Grantham cited that 20% decline the day before, May 18, when he told CNBC: “The other day [May 12], we were down 19.9% on the S&P 500, and about 27% on the Nasdaq. At a minimum, we are likely to do twice that. If we’re unlucky—which is quite possible—we would do three legs like that.” By citing “three legs,” Grantham implied an 80% decline from the peak due to seeing the worst of the three deepest bear markets of the last 50 years, all at once – the worst of the Tech Wreck of 2000-02, the worst of the housing bust of 2008, and the worst of the decade-long stagflation of the 1970s. That kind of vision takes a combination of a ghoulish imagination and some clinical depression.
Instead, I’d look at the 20% bear market threshold he cited. Since 1990, we have dodged a bear market in five of the eight times the S&P 500 came within a fraction of a 20% correction. Only three times did we tip over into a bear market over 20%, and they each ran over 30% (2000-2, 2008-9, and the 2020 COVID crash). It’s almost like traders fear a crash so much that they try to avoid a 20% downdraft “at all costs.”
Consider these instances in which the S&P 500 dipped below 20% intra-day, but closed short of -20%:
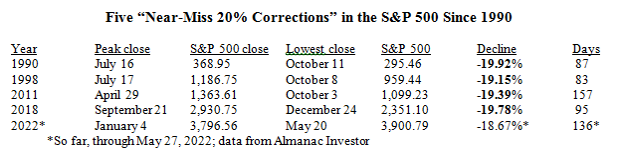
A bear market is traditionally defined as a 20% decline in the S&P 500 closing, but in 2022 that index once again refused to fall 20% on a closing basis, although it has declined over 19% on an intra-day basis four times already. It’s almost like savvy traders don’t want to see that “red line” crossed, so they rally and buy as the 20% decline level approaches, as it did on Friday, May 20, and again last Tuesday, May 24.
Nasdaq is another animal – Up more, down more
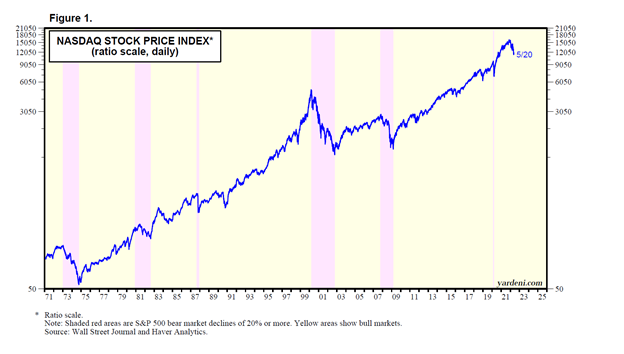
NASDAQ is in a bear market for sure, but don’t forget that it is still up 795% since the start of the long-term bull market in 2009, so we’re likely seeing an overdue “reversion to the mean” in that index. In the same time period, the S&P 500 is up just 468%, so it didn’t earn as much mean reversion as NASDAQ.
Behold NASDAQ’s “brutal bear market” in context (it’s the little dip in the upper right-hand corner).
20 questions about the 20% bear market barrier
In the only three bear markets of the 21st Century: (1) The dot-com bubble of 2000, (2) the real-estate bubble and financial crisis of 2008, and (3) the brutal onset of COVID in 2020, ask yourself these 20 questions about the current situation, boiling down to one question: Ask yourself if this is a bear market.
-
Is a bear market (like 2000-02, 2008-9, or 2020) justified by today’s fundamentals?
-
Specifically, is today’s NASDAQ dominated by no-earnings “bubble” stocks, as in 2000?
-
Or are “zombie banks” failing by the dozens each year, as in 2008 through 2013?
-
Are real estate loans being bundled into AAA shell securities, as in 2005-08?
-
Is COVID at the beginning, or near its end? (Is the U.S. economy still locked down?)
-
Are people being laid off with no jobs available, as in a real recession?
-
Will most workers probably come back to work once they run out of money?
-
Will technology products and services become more (or less) important in the future?
-
Will supply disruptions be solved over time, or will they last forever?
-
Are we really headed for a recession, as long as GDP growth remains around +2% this quarter?
-
Are we likely to see more political balance in Congress after the 2020 mid-term elections?
-
Will the resulting “gridlock” (from a more balanced Congress) be good or bad for stocks?
-
Is the third year of an election cycle good for stocks (like 1995, 1999, 2003, 2007, 2011, 2015, or 2019)?
-
Is the U.S. still #1 for currency, stock market, economy – and refugee destination?
-
Does the S&P 500 still deliver more income than most bonds or bank savings accounts?
-
Have stocks ultimately grown through all past recessions – from the 1950s onward?
-
With QE ending, QT starting, and interest rates rising, isn’t it likely that inflation will peak this year?
-
Are people freer to act, move, think, and speak in the U.S. than in China, Europe, or even Australia?
-
When people work from their homes and commute less, aren’t energy (and other) costs lower?
-
If traders fear crossing the 20% correction barrier on the S&P 500, isn’t that sort of a “floor”?
Author

Jacob Wolinsky
ValueWalk
Jacob Wolinsky is the founder of ValueWalk, a popular investment site. Prior to founding ValueWalk, Jacob worked as an equity analyst for value research firm and as a freelance writer. He lives in Passaic New Jersey with his wife and four children.


