|

Pound Sterling Price News and Forecast: GBP/USD has slipped significantly to near 1.1570

GBP/USD tumbles to near 1.1570 amid firmer DXY, US ISM PMI buzz

The GBP/USD pair is falling like a house of cards as the US dollar index (DXY) has reclaimed the round-level hurdle of 109.00 in the Asian session. The asset is declining towards its two-year low near 1.1500. The cable has displayed a vertical downside move after surrendering the critical support of 1.1600. Also, the asset has continued its four-day losing streak after slipping below Wednesday’s low at 1.1599.

Read More ...

GBP/USD

Overview
Today last price1.158
Today Daily Change-0.0042
Today Daily Change %-0.36
Today daily open1.1622
 
Trends
Daily SMA201.1942
Daily SMA501.2013
Daily SMA1001.2264
Daily SMA2001.2809
 
Levels
Previous Daily High1.1694
Previous Daily Low1.1599
Previous Weekly High1.19
Previous Weekly Low1.1717
Previous Monthly High1.2294
Previous Monthly Low1.1599
Daily Fibonacci 38.2%1.1635
Daily Fibonacci 61.8%1.1658
Daily Pivot Point S11.1583
Daily Pivot Point S21.1543
Daily Pivot Point S31.1488
Daily Pivot Point R11.1678
Daily Pivot Point R21.1733
Daily Pivot Point R31.1773


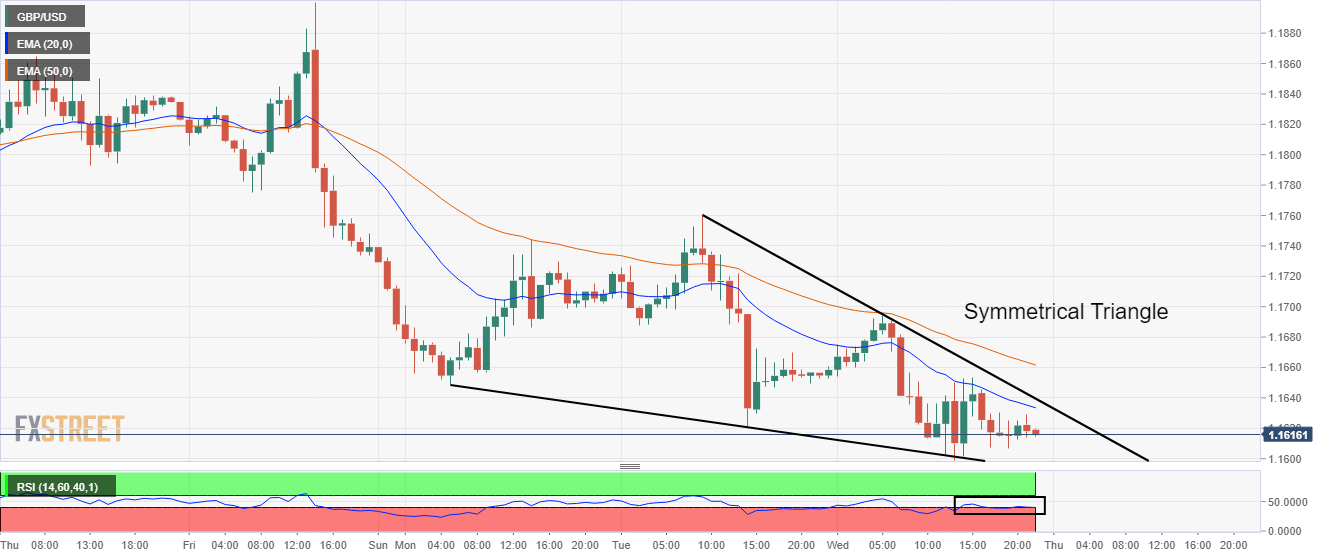
GBP/USD Price Analysis: Downside momentum loss to support cable, 1.1650 a critical hurdle

The GBP/USD pair is displaying back-and-forth moves in a narrow range of 1.1609-1.1623 in the early Tokyo session. The cable has turned sideways after defending the critical support of 1.1600. Broadly, the asset is oscillating in a wider range of 1.1607-1.1645 and is likely to display volumes and wider ticks.

Read More ...

Author

More from FXStreet Team
Share:

Markets move fast. We move first.

Orange Juice Newsletter brings you expert driven insights - not headlines. Every day on your inbox.

By subscribing you agree to our Terms and conditions.

Editor's Picks

EUR/USD bears await break below 100-day SMA support near 1.1665 area

The EUR/USD pair attracts heavy selling for the second straight day and dives to a nearly four-week trough, around the 1.1670 region, during the Asian session on Monday. Bearish traders now await a sustained break below the 100-day Simple Moving Average before positioning for an extension of the recent pullback from a three-month top, or levels just above the 1.1800 mark touched on December 24.

GBP/USD falls toward 1.3400 near 50-day EMA

GBP/USD extends its losses for the second successive session, trading around 1.3420 during the Asian hours on Monday. The technical analysis of the daily chart indicates that the 14-day Relative Strength Index at 53 has eased from near overbought, indicating that momentum has cooled while remaining above the midline. RSI holds above 50, keeping a modest bullish bias.

Gold on fire at the start of the week on US-Venezuela tensions

Gold regains upside traction early Monday as flight to safety prevails on Venezuela turmoil. The US Dollar finds strong haven demand, caps Gold’s upside as focus shifts to US jobs data. Gold’s daily technical setup suggests that more upside remains in the offing.

Bulls firmly in control as Bitcoin breaks $93K, Ethereum and Ripple extend gains

Bitcoin, Ethereum, and Ripple extended their rallies on Monday, gaining more than 4%, 6%, and 12%, respectively, in the previous week. The top three cryptocurrencies by market capitalization could continue to outperform, with bulls in control of the momentum.

Economic outlook 2026-2027 in advanced countries: Solidity test

After a year marked by global economic resilience and ending on a note of optimism, 2026 looks promising and could be a year of solid economic performance. In our baseline scenario, we expect most of the supportive factors at work in 2025 to continue to play a role in 2026.

Crypto market outlook for 2026

Year 2025 was volatile, as crypto often is.  Among positive catalysts were favourable regulatory changes in the U.S., rise of Digital Asset Treasuries (DAT), adoption of AI and tokenization of Real-World-Assets (RWA).