Phillips 66 (PSX) breaks critical uptrend: Retracement setup or reversal signal?

Phillips 66 (PSX) is a leading downstream energy company specializing in refining, midstream, chemicals, and marketing operations. The company share price just handed technical traders a textbook lesson in trendline dynamics. After riding a beautifully constructed ascending support line from June through early December, the stock has done something that immediately catches an experienced analyst's attention—it broke down.
Let's unpack what's happening here, because this isn't just noise on a chart.
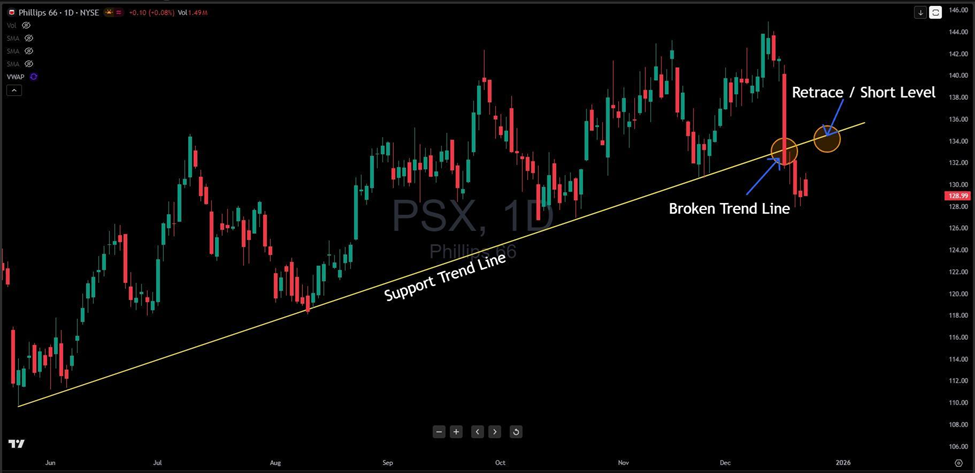
Since mid-year, PSX carved out a steady uptrend, with that yellow support trendline acting like a dependable floor beneath price action. Multiple times throughout the summer and fall, when selling pressure emerged, buyers stepped in right at that line. It worked flawlessly—until it didn't. In late December, PSX sliced through that support like it suddenly ceased to matter, and that's where things get interesting for traders on both sides of the market.
The stock currently trades around $129.99, clearly below what was once reliable support. But here's what separates novice chart-watchers from seasoned technicians: that broken trendline doesn't just disappear. It transforms. What formerly acted as a springboard for buyers could now function as a ceiling for any rally attempts. In technical analysis, we call this phenomenon a polarity shift.
This is where the "Retrace / Short Level" annotation becomes relevant. If PSX attempts to rally back toward the $134-136 zone—right around that former trendline—we're likely watching a retracement into fresh resistance. For bearish traders, that area represents a high-probability zone to establish short positions, betting that the breakdown will hold and price continues lower. The logic is simple: previous support often becomes new resistance.
The bullish counter-argument is simply that sometimes breakdowns fail. If PSX can reclaim and close above $136 with conviction, it would suggest the trendline violation was a false breakdown—what we call a bear trap. That scenario would likely trigger short-covering and renewed buying interest, potentially sending the stock back toward recent highs near $145.
So what's the play here? For bears, patience pays. Wait for that bounce toward $134-136 before initiating shorts, with stops above $137 to limit risk if you're wrong. For bulls, you need proof of concept: a decisive reclaim of the broken trendline with volume confirmation before considering long entries.
What would invalidate this breakdown scenario? A quick, powerful move back above $136 that holds for multiple sessions. Until that happens, the technical bias tilts bearish, with the broken trendline now acting as overhead resistance rather than underlying support. The energy sector has been volatile lately, and PSX's chart reflects that uncertainty perfectly—making this a setup worth monitoring closely regardless of your directional bias.
Author

Benjamin Pool
Verified Investing
A seasoned financial expert with a passion for empowering individuals to mastering smart money management.


