Pepsico may end the bearish cycle from 2023 soon

Pepsico ($PEP) has been in a bearish cycle since May 2023. However, the cycle is getting extreme and the sell-off may relax in the coming weeks or months. While we may not know what will trigger the buyers to find entries soon, traders should be aware of this key zone for opportunities.
PepsiCo is a global food and beverage company with the headquarters in New York. It was founded in 1965 through the merger of Pepsi-Cola and Frito-Lay. The company operates in over 200 countries and has a diverse portfolio of brands, including Pepsi, Mountain Dew, Lay’s, Doritos, Gatorade, Tropicana, and Quaker.
Pepsico is historically a profitable company since its stock went public in the 60s. However, since May 2023 the stock prices have been on a bearish cycle – down by 28%. The headlines believed the decline has been driven largely by slowing sales growth particularly on snacks and sugary drinks. This has put pressure on the company’s revenue and profit margin outlook. However, from the lens of the Elliott wave theory, the decline should have been expected. A 5-wave bullish cycle evolved in March 2020 immediately after the COVID-19 sell-off. After such a 5-wave rally, 3 -wave decline should follow to correct the 5-wave cycle. That’s exactly what the Pepsico stock prices have been observing since May 2023. However, this cycle appears to be closing to completion. If that is the case, the all-time bullish cycle from the all-time lows should resume.
Pepsico Elliott Wave analysis – 02.16.2025
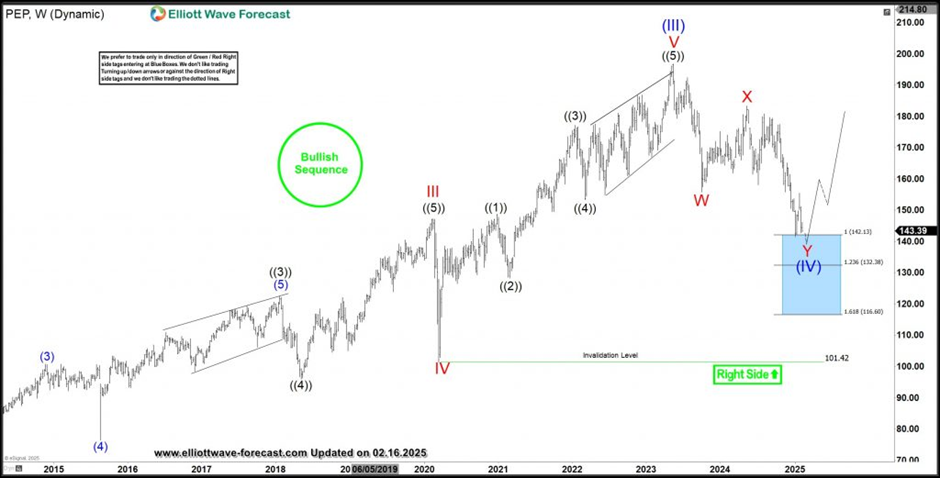
The weekly chart above shows the ending waves of wave (III) of ((III)) of the all-time bullish cycle from the all-time lows. The decline from March 2023 shows a double zigzag (7-swing structure) corrective sequence entering the extreme zone for wave (IV). Within a bullish sequence, traders should look forward to go long from the dips. On the other hand, traders should look at shorting bounces in a bearish sequence. That’s our idea of trading that we like presenting to members of Elliottwave-Forecast.
The chart above shows the extreme zone at 142.13-116.60. Price is within the zone but may extend lower into it with current bearish leg from January 2025. However, we can expect at least a 3-swing bounce from this zone if not an impulse recovery starting wave (V). Buyers will look at exploiting this zone for a Long opportunity with stop slightly below 116.6.
Author

Elliott Wave Forecast Team
ElliottWave-Forecast.com


