PayPal Holdings Inc. (PYPL) stocks Elliott Wave technical analysis [Video]
![PayPal Holdings Inc. (PYPL) stocks Elliott Wave technical analysis [Video]](https://editorial.fxsstatic.com/images/i/Equity-Index_Nasdaq-1_XtraLarge.jpg)
PYPL Elliott Wave Analysis TradingLounge.
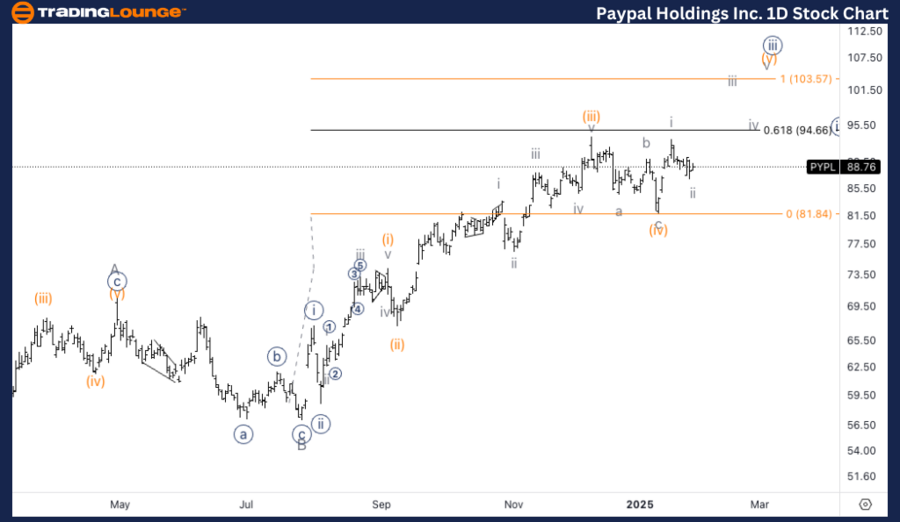
PayPal Holdings Inc., (PYPL) Daily Chart.
PYPL Elliott Wave technical analysis
Function: Trend.
Mode: Corrective.
Structure: Impulsive.
Position: Wave {iii} of C.
Direction: Upside in wave {iii}.
Details: We ae looking at further upside within Minute wave {iii} as we seem to keep unfolding higher towards TradingLevel1 at 100$ where we expect a larger pullback, potential in wave {iv}.
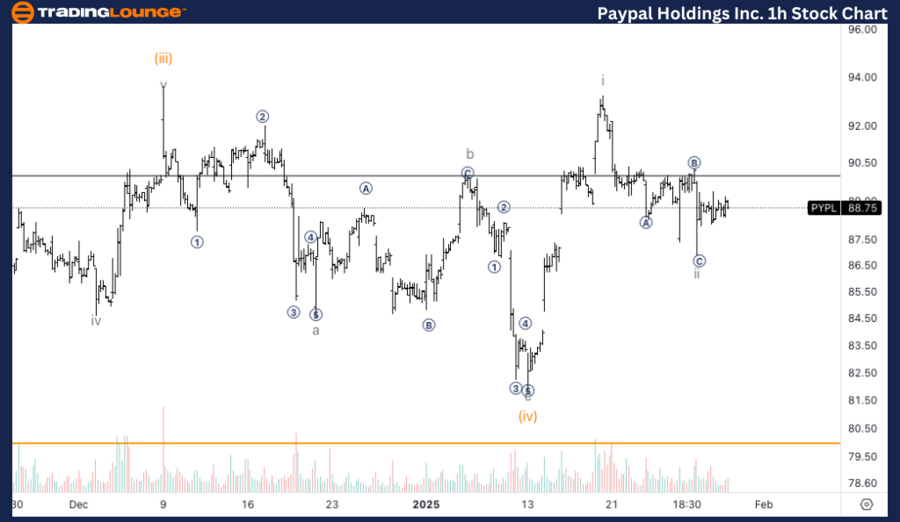
PayPal Holdings Inc., (PYPL) 1H Chart.
PYPL Elliott Wave technical analysis
Function: Trend.
Mode: Corrective.
Structure: Impulsive.
Position: Wave ii of (v).
Direction: Bottom in wave ii.
Details: We seem to have a bottom in wave ii as we can identify a three wave move within wave iii. Looking for further upside into wave iii which could need to happen during the upcoming sessions.
This Elliott Wave analysis of PayPal Holdings Inc., (PYPL) outlines both the daily and 1-hour chart structures, highlighting the current trends and possible future price movements.
PYPL Elliott Wave technical analysis – Daily chart
PayPal Holdings Inc. (PYPL) is showing signs of further upside within Minute wave {iii} as the price moves higher, approaching TradingLevel1 at $100. We anticipate a larger pullback possibly forming wave {iv} near this level before the uptrend resumes.
PYPL Elliott Wave technical analysis – One-hour chart
In the 1-hour chart, it appears that wave ii has bottomed out, with a three-wave move observed within wave iii. We anticipate further upside development in wave iii, which could play out in the coming sessions.
Technical analyst: Alessio Barretta.
PYPL Elliott Wave technical analysis [Video]
Author

Peter Mathers
TradingLounge
Peter Mathers started actively trading in 1982. He began his career at Hoei and Shoin, a Japanese futures trading company.


