|

Pan American Silver (PAAS) pullback in progress

Pan American Silver is a Canadian mining company that owns and operates mines in Mexico, Peru, Bolivia, and Argentina. As one of the world’s premier silver producers, they focus on silver and gold mining throughout the Americas. Their vision emphasizes excellence in discovery, engineering, innovation, and sustainable development. Below we update the Elliott Wave outlook of the company.

PAAS monthly Elliott Wave chart

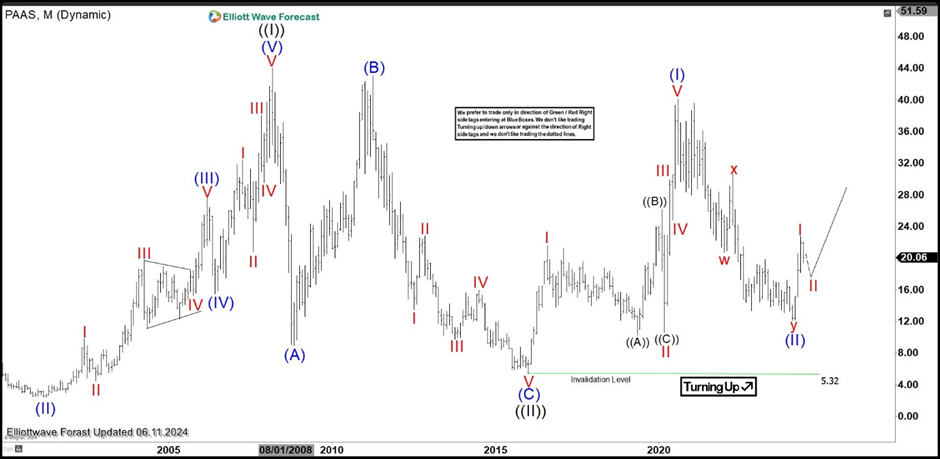
Monthly Elliott Wave chart of Pan American Silver (PAAS) above shows the stock ended wave ((II)) pullback at 5.32 on January 2016 low. The stock then started to rally in wave ((III)) as an impulse. Up from wave ((II)), wave (I) ended at 40.11. Pullback in wave (II) has also completed at 12.18. The stock has since rallied higher again as an impulse. While pullback stays above 5.32, expect the stock to extend higher.

PAAS daily Elliott Wave chart

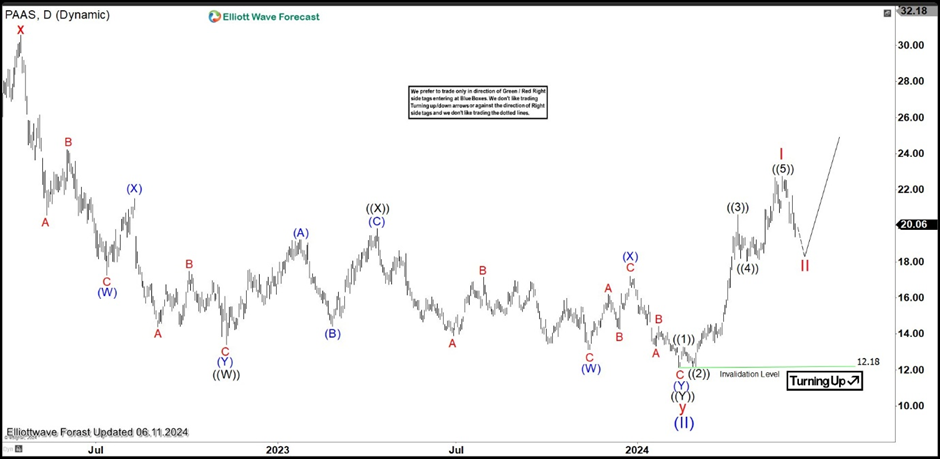
Daily Elliott Wave Chart of Pan American Silver (PAAS) above shows the rally from wave (II) low at 12.18 unfolded as an impulsive structure. Up from wave (II), wave ((1))) ended at 13.28 and wave ((2)) pullback ended at 12.19. The stock then extended higher with separation wave ((3)) which ended at 20.6. Pullback in wave ((4)) has ended at 18.01 and the stock resumed higher in wave ((5)) towards 22.75 which completed wave I in higher degree. Pullback in wave II is currently in progress to correct cycle from 2.13.2024 low in 3, 7, or 11 swing before it resumes higher. Near term, as far as pivot at 12.18 low stays intact, expect pullback to find support in 3, 7, or 11 swing for further upside.

Author

Elliott Wave Forecast Team

Elliott Wave Forecast Team

ElliottWave-Forecast.com

More from Elliott Wave Forecast Team
Share:

Editor's Picks

AUD/USD eyes 0.7150 barrier nine-day EMA

AUD/USD inches higher after registering modest losses in the previous day, trading around 0.7130 during the Asian hours. The technical analysis of the daily chart indicates that the pair is moving sideways within the rectangle pattern, suggesting a consolidation as neither the bulls nor the bears have enough momentum to take control of the market.

USD/JPY trades below 160.00 intervention threshold; bullish bias intact

The USD/JPY pair attracts some sellers during the Asian session amid fears that authorities will step in again to prop up the Japanese Yen. Furthermore, the Israel-Lebanon truce prompts some profit-taking around the US Dollar and exerts downward pressure on the currency pair.

Gold puts its 200-day SMA to the test near $4,420

Gold keeps the bullish stance in place in the latter part of Thursday’s session, although a convincing break above the key $4,500 mark per troy ounce still remains elusive. The precious metal’s advance comes amid the resurgence of some selling interest around the Greenback, improving risk sentiment, and declining US Treasury yields across the board.

Bitcoin’s massive storm is back: Why the sell-off is far from over

Bitcoin price action over the last few weeks has felt less like a normal, healthy correction and more like a slow grinding crash that continues to wreak havoc on holdings and trading accounts. And everything suggests that the dramatic crash isn’t over.

Nonfarm payrolls: Testing the limits of Fed policy patience

The upcoming nonfarm payrolls report for May will provide the final update on the US labor market before Kevin Warsh attends his first policy meeting as the new Fed Chair later this month.

Recession on paper: What really moves the Canadian Loonie now?

Statistics Canada handed the headline writers a gift and the analysts a headache. Real GDP shrank 0.1% on an annualized basis in the first quarter, and with the fourth quarter of 2025 revised down to a 1.0% contraction, that is two negative quarters in a row, the textbook definition of a technical recession and Canada's first since the pandemic.