Palantir Technologies (PLTR), Inc. is a holding company, which engages in the development of data integration and software solutions. It operates through the Commercial and Government segments. The firm offers automotive, financial compliance, legal intelligence, mergers and acquisitions solutions.
Palantir (PLTR) daily chart September 2023
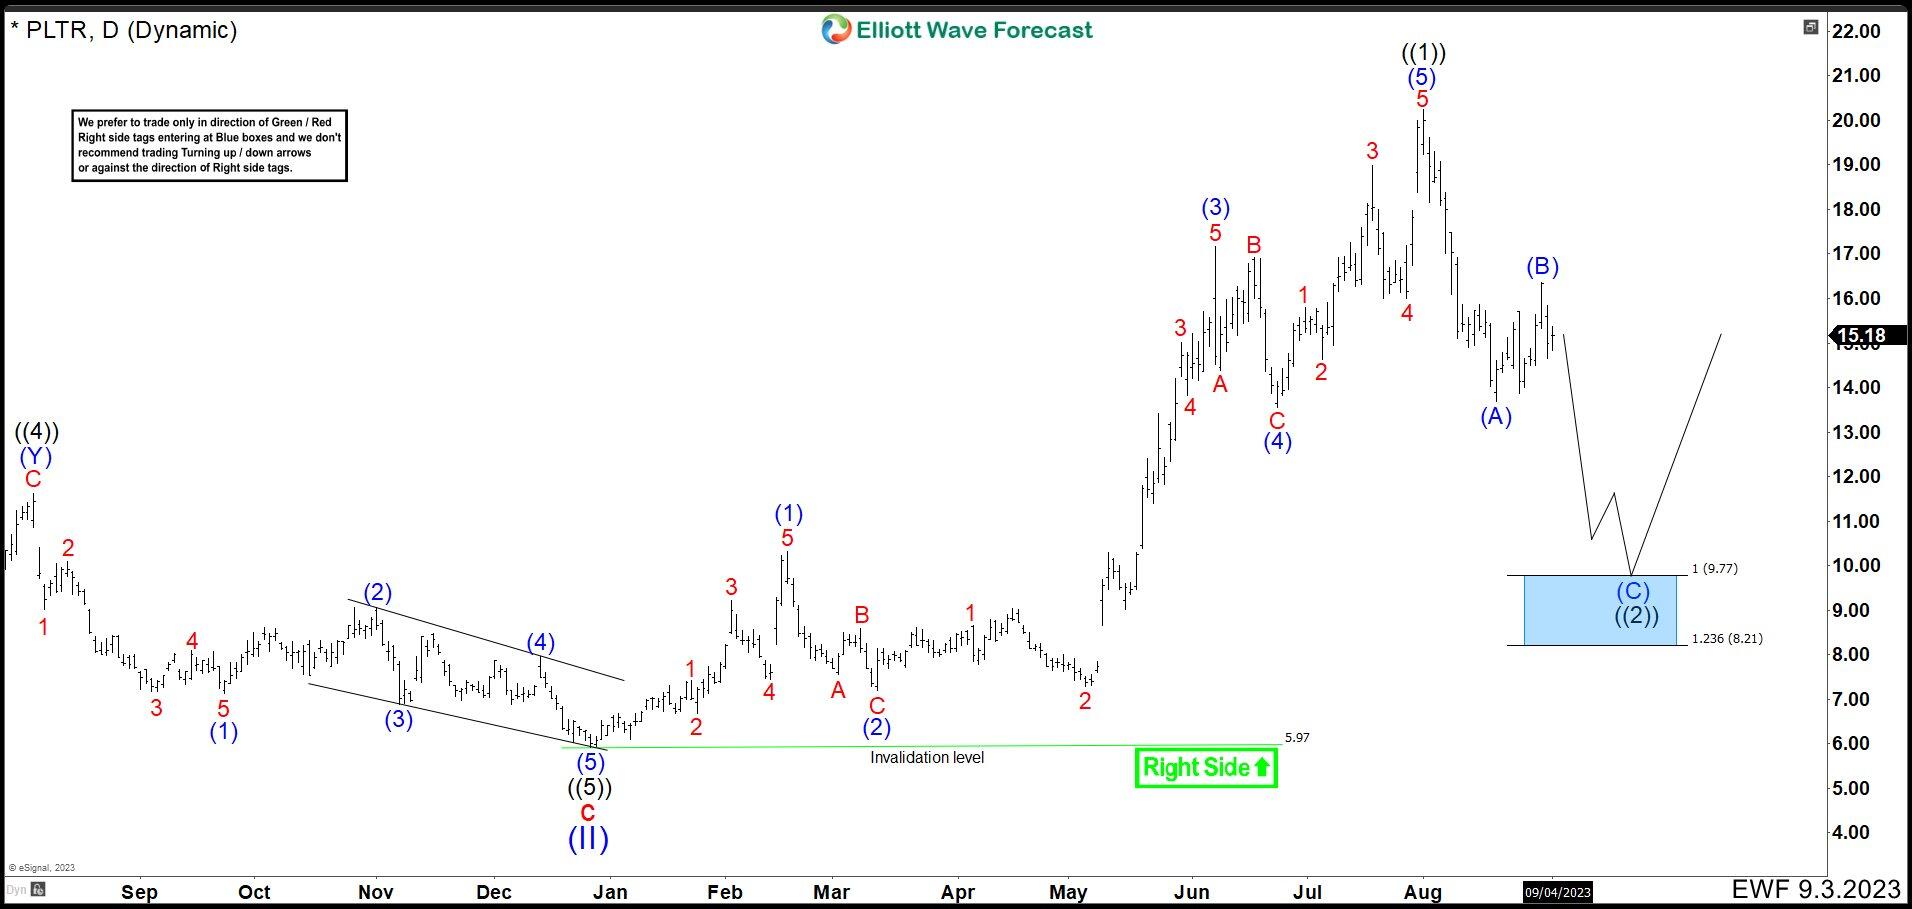
The last blog in April, we were looking to break $7.17 March low before PLTR turns higher. However, the market couldn’t break the price and it rally from $7.28 almost tripling the share price. At the end, the final structure was as follows: the wave (1) did not change, it finished at $10.31 higher. The pullback as wave (2) ended at $7.17 and rallied in 5 swings completing an impulse and wave (3) at $17.17. Then, market made a little stop for a retracement and built a flat Elliott wave structure as wave (4) ended at $13.55 in June. At this point, PLTR made a last push higher as an impulse completing wave (5) at $20.27 and also ending the whole impulse from December 2022 low as wave ((1)).
Palantir (PLTR) daily chart alternative September 2023
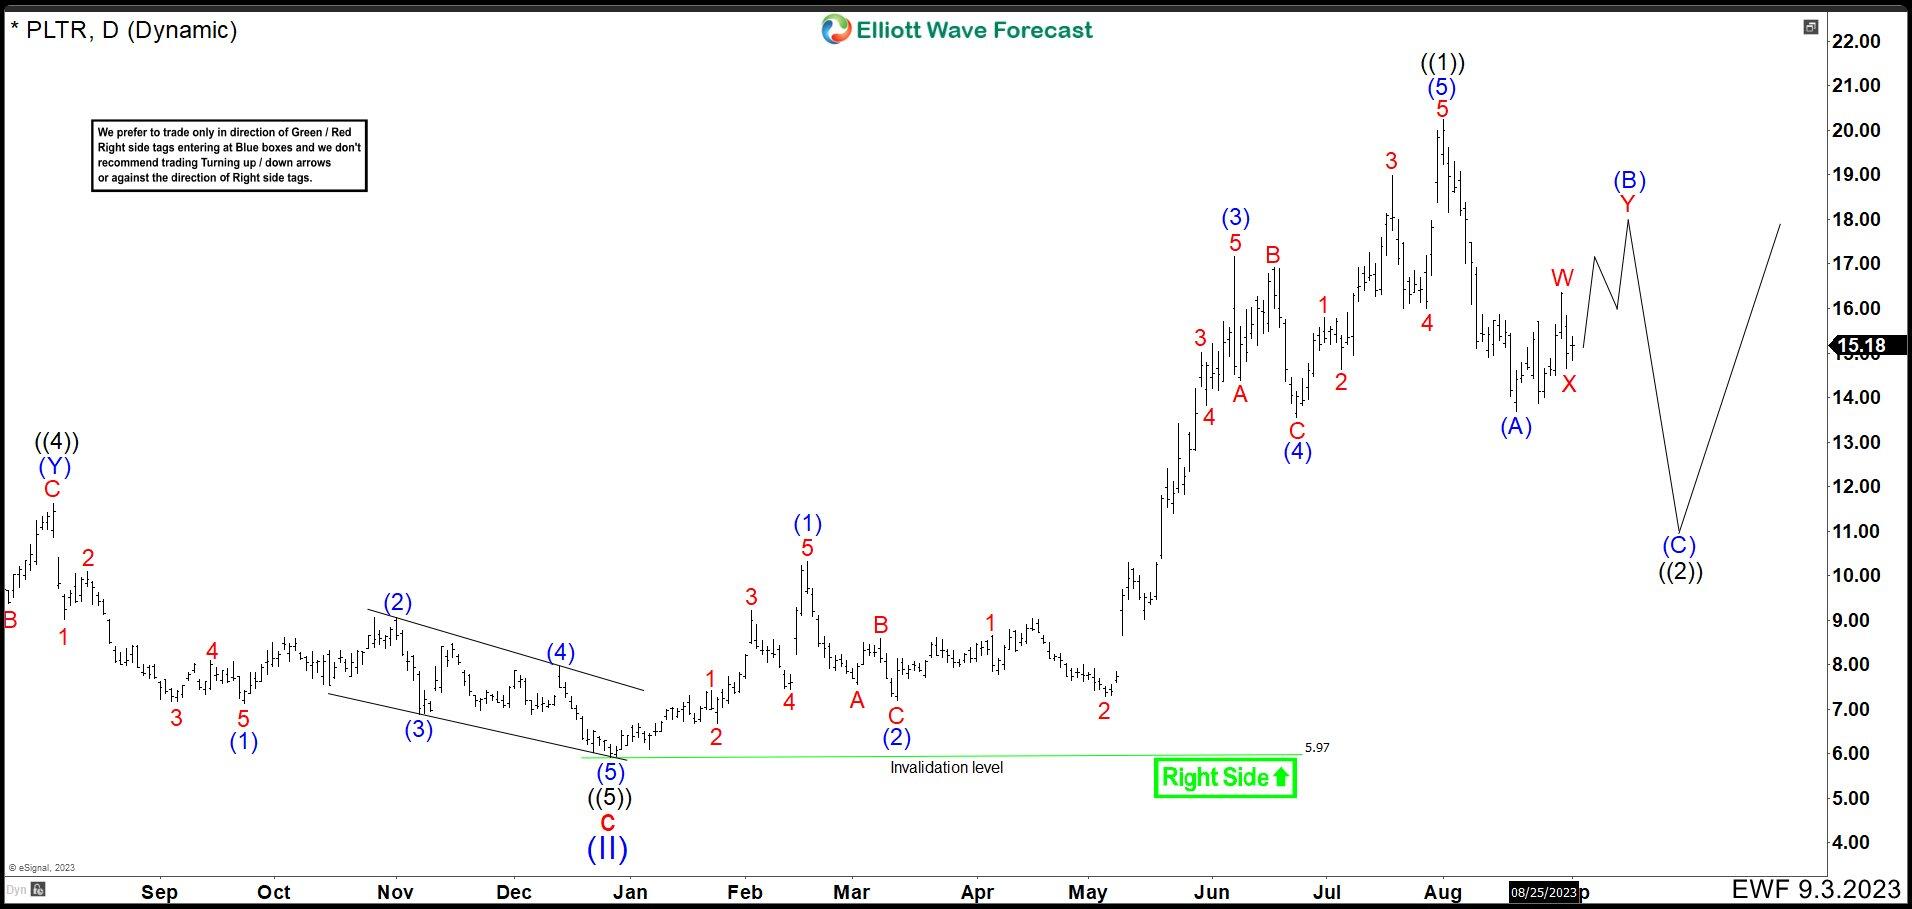
Down from $20.27 high, PLTR dropped strongly starting the correction as wave ((2)). The first swing lower ended at $13.69 as wave (A). We can see 3 swings higher from here to end wave (B) at $16.34. As price action stays below this level, we are expecting to continue lower in wave (C). Market should drop toward a blue box in $9.77 – $8.21 area where PLTR should rally again. As alternative, we are showing a second chart where wave (B) is not completed yet. Therefore, in this case the market could make a double correction WXY before entering in wave (C) lower. This path would be confirmed if Palantir breaks above $16.34 and we would expect 3 swings higher to complete wave (B) below $20.27 high.
FURTHER DISCLOSURES AND DISCLAIMER CONCERNING RISK, RESPONSIBILITY AND LIABILITY Trading in the Foreign Exchange market is a challenging opportunity where above average returns are available for educated and experienced investors who are willing to take above average risk. However, before deciding to participate in Foreign Exchange (FX) trading, you should carefully consider your investment objectives, level of xperience and risk appetite. Do not invest or trade capital you cannot afford to lose. EME PROCESSING AND CONSULTING, LLC, THEIR REPRESENTATIVES, AND ANYONE WORKING FOR OR WITHIN WWW.ELLIOTTWAVE- FORECAST.COM is not responsible for any loss from any form of distributed advice, signal, analysis, or content. Again, we fully DISCLOSE to the Subscriber base that the Service as a whole, the individual Parties, Representatives, or owners shall not be liable to any and all Subscribers for any losses or damages as a result of any action taken by the Subscriber from any trade idea or signal posted on the website(s) distributed through any form of social-media, email, the website, and/or any other electronic, written, verbal, or future form of communication . All analysis, trading signals, trading recommendations, all charts, communicated interpretations of the wave counts, and all content from any media form produced by www.Elliottwave-forecast.com and/or the Representatives are solely the opinions and best efforts of the respective author(s). In general Forex instruments are highly leveraged, and traders can lose some or all of their initial margin funds. All content provided by www.Elliottwave-forecast.com is expressed in good faith and is intended to help Subscribers succeed in the marketplace, but it is never guaranteed. There is no “holy grail” to trading or forecasting the market and we are wrong sometimes like everyone else. Please understand and accept the risk involved when making any trading and/or investment decision. UNDERSTAND that all the content we provide is protected through copyright of EME PROCESSING AND CONSULTING, LLC. It is illegal to disseminate in any form of communication any part or all of our proprietary information without specific authorization. UNDERSTAND that you also agree to not allow persons that are not PAID SUBSCRIBERS to view any of the content not released publicly. IF YOU ARE FOUND TO BE IN VIOLATION OF THESE RESTRICTIONS you or your firm (as the Subscriber) will be charged fully with no discount for one year subscription to our Premium Plus Plan at $1,799.88 for EACH person or firm who received any of our content illegally through the respected intermediary’s (Subscriber in violation of terms) channel(s) of communication.
Recommended content
Editors’ Picks
EUR/USD bounces back, trades above 1.0860

EUR/USD bounced from a fresh weekly low of 1.0827, as the US Dollar lost steam following a weak ISM Manufacturing PMI report and words from Federal Reserve Chair Jerome Powell. Powell reiterated its hawkish message, dismissing potential rate cuts in the near future.
GBP/USD turns north ahead of the weekly close, approaches 1.2700

GBP/USD extended its rebound from near 1.2600 and is approaching 1.2700 on the back of a weaker US Dollar. The Greenback accelerated to the downside following comments from Fed’s Powell.
Gold resumes advance and approaches record highs

Gold remains near record highs and achieved its highest monthly close ever in November. Global bond yields continue to decline as inflation further cools, supporting the upside in XAU/USD. With central banks expected to remain on hold, the focus will be US labor market data.
Solana likely to extend gains as DeFi airdrop season could boost user base

Solana ecosystem will see airdrops from projects like Jupiter, Marginfi, Drift, Zeta and Jito. Solana users are projected to increase between 30% and 80% from native token launches, according to Messari’s latest report. SOL price extends rally, yielding nearly 4% daily gains.
Tesla Stock News: Cybertruck excitement fails to sustain TSLA price as chart signals more downside

TSLA stock sinks three days in a row despite Cybertruck unveiling. Analysts conclude that Cybertruck will find it difficult to turn a profit. TSLA stock is the midst of forming a bearish Three Black Crows pattern on the daily chart.