|

Oracle (ORCL) technical breakout confirms further upside

Oracle Corp (NYSE: ORCL) has doubled in value during 2025, consistently breaking into new all-time highs. This powerful surge establishes a clear bullish trend. Today, we analyze the underlying Elliott Wave structure driving this momentum. Our analysis outlines precise pathways and upside targets for the next leg higher.

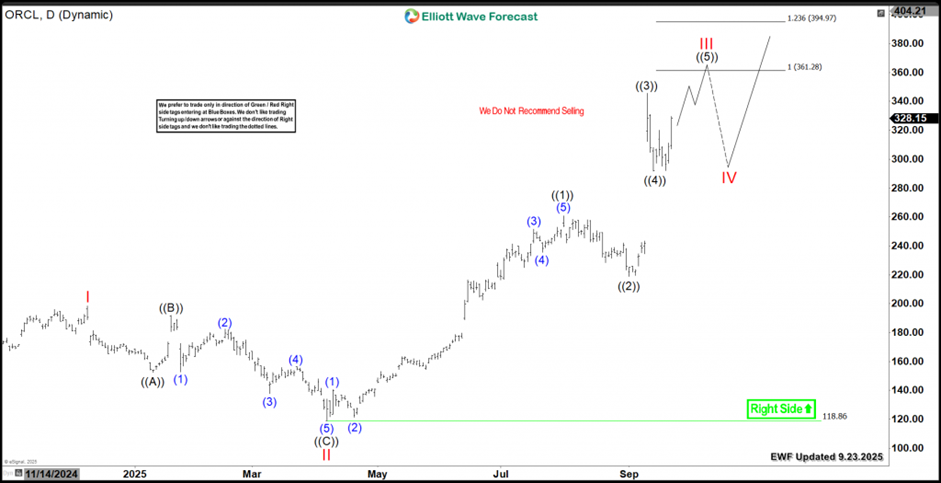
Elliott Wave analysis

Oracle launched a strong 3-wave advance from its April 2025 low, pushing decisively into new all-time highs. This structure confirms an incomplete bullish sequence within the current daily cycle. Therefore, the rally has further room to extend.

ORCL completed Wave ((1)) at $260.87, then corrected to $218.79 in Wave ((2)). Subsequently, Wave ((3)) surged to $345.72 before the recent Wave ((4)) pullback found support at $297.75. The stock must now hold above this level to maintain its bullish structure.

Consequently, ORCL should now advance in Wave ((5)) toward the $361-$394 target zone. This area represents the equal legs projection for Wave ((3))-((5)). Ultimately, this rally will complete the larger Wave III.

Following this peak, a Wave IV pullback will emerge. This correction will create another strategic buying opportunity before the final Wave V rally resumes. Our Blue Box system will identify the optimal entry point for that next phase.

ORCL daily chart 09.23.2025

Chart

ORCL’s robust bullish structure will support the stock through all upcoming pullbacks. This creates strategic opportunities to buy daily and weekly dips using our Elliott Wave strategy. Traders should ideally enter positions after the stock completes a 3, 7, or 11-swing corrective sequence. Furthermore, our extreme Blue Box system pinpoints optimal entries with high precision. This methodology provides clarity and confidence for capturing the next leg higher.

Author

Elliott Wave Forecast Team

Elliott Wave Forecast Team

ElliottWave-Forecast.com

More from Elliott Wave Forecast Team
Share:

Editor's Picks

EUR/USD recedes to daily lows near 1.1850

EUR/USD keeps its bearish momentum well in place, slipping back to the area of 1.1850 to hit daily lows on Monday. The pair’s continuation of the leg lower comes amid decent gains in the US Dollar in a context of scarce volatility and thin trade conditions due to the inactivity in the US markets.

GBP/USD resumes the downtrend, back to the low-1.3600s

GBP/USD rapidly leaves behind Friday’s decent advance, refocusing on the downside and retreating to the 1.3630 region at the beginning of the week. In the meantime, the British Pound is expected to remain under the microscope ahead of the release of the key UK labour market report on Tuesday.

Gold looks inconclusive around $5,000

Gold partially fades Friday’s strong recovery, orbiting around the key $5,000 region per troy ounce in a context of humble gains in the Greenback on Monday. Additing to the vacillating mood, trade conditions remain thin amid the observance of the Presidents Day holiday in the US.

Bitcoin consolidates as on-chain data show mixed signals

Bitcoin price has consolidated between $65,700 and $72,000 over the past nine days, with no clear directional bias. US-listed spot ETFs recorded a $359.91 million weekly outflow, marking the fourth consecutive week of withdrawals.

The week ahead: Key inflation readings and why the AI trade could be overdone

It is likely to be a quiet start to the week, with US markets closed on Monday for Presidents Day. European markets are higher across the board and gold is clinging to the $5,000 level after the tamer than expected CPI report in the US reduced haven flows to precious metals.

XRP steadies in narrow range as fund inflows, futures interest rise

Ripple is trading in a narrow range between $1.45 (immediate support) and $1.50 (resistance) at the time of writing on Monday. The remittance token extended its recovery last week, peaking at $1.67 on Sunday from the weekly open at $1.43.