On Semiconductor Corp (ON) on the brink of a major break-out: What’s next? [Video]
![On Semiconductor Corp (ON) on the brink of a major break-out: What’s next? [Video]](https://editorial.fxstreet.com/images/Markets/Equities/Industries/Media/music-board.jpg)
US-based ON Semiconductor Corporation (ON) offers a broad range of power and signal management, logic, discrete, and custom devices for various applications. The company operates globally with manufacturing facilities, sales offices, and design centers. ON is divided into three groups — Advanced Solutions, Intelligent Sensing, and Power Solutions. Its acquisitions have broadened the company’s technical capabilities and exposure to new end markets. Product lines include bipolar transistors, diodes, filters, FETs, rectifiers, thyristors, AC-DC controllers, DC-DC converters, drivers, voltage controllers, references, and supervisors. ON is listed on NASDAQ and is a component of S&P 500 under Information Technology.
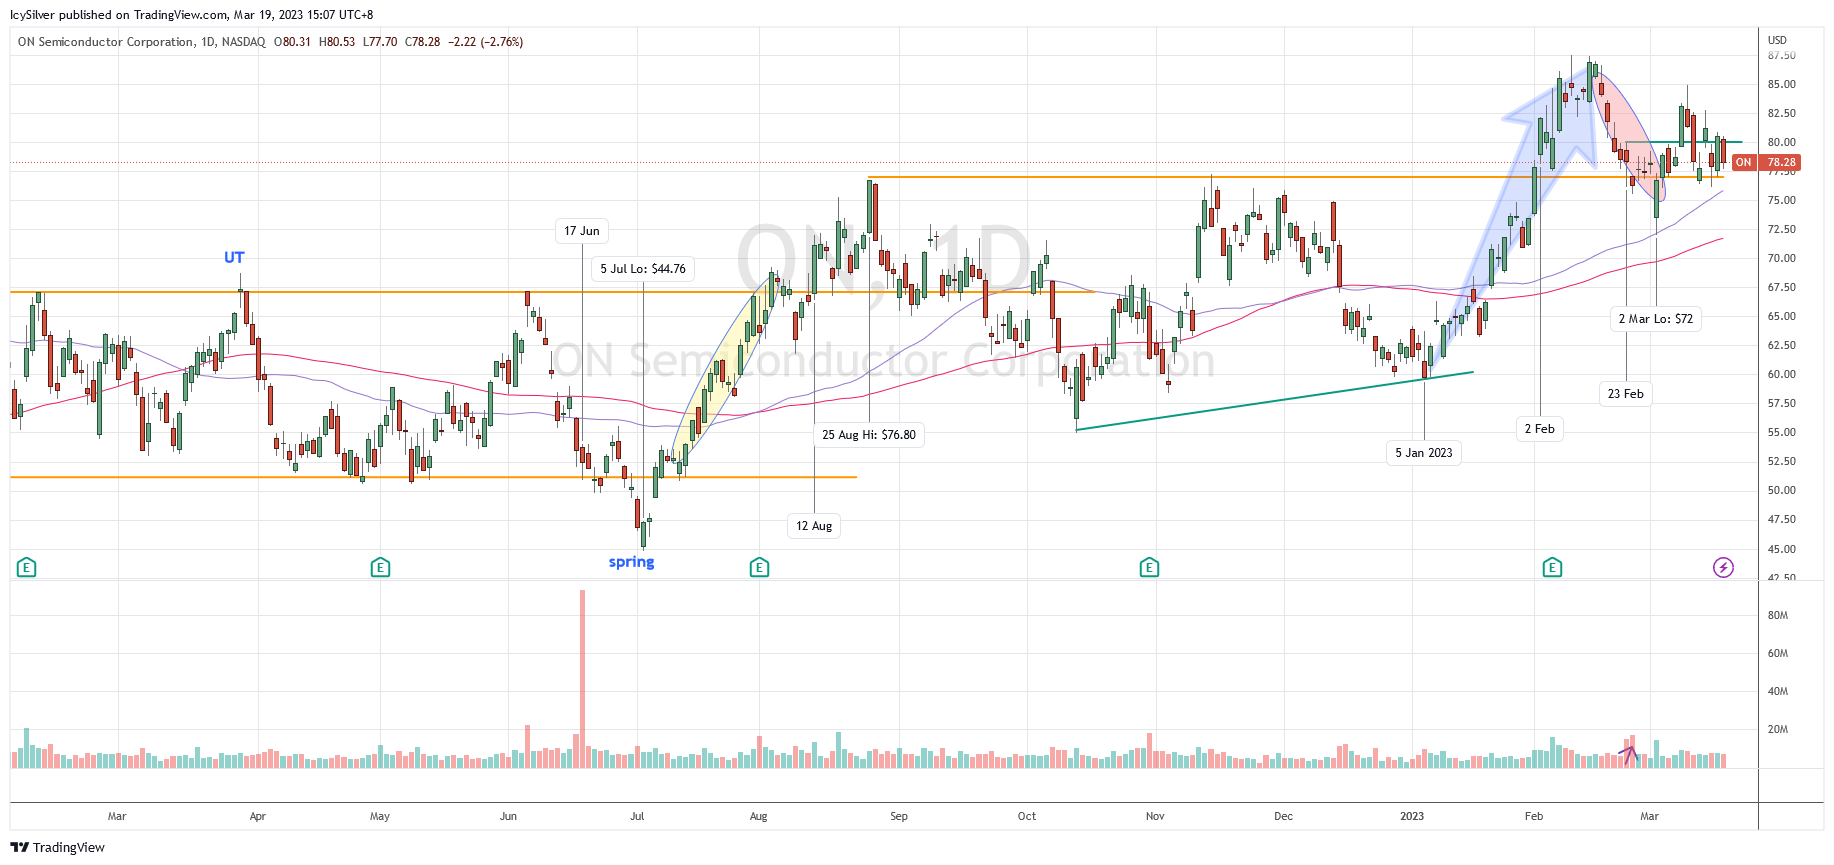
Breaking out of Wyckoff accumulation
ON started 2022 moving in a trading range between $51 and $61. There were few attempts to challenge the resistance at $61 but unable to commit above, forming Wyckoff upthrust (UT). There was a huge spike of volume on 17 June but the resulting bar was narrow body, suggesting the presence of absorption. This could be explained by Wyckoff effort versus result whereby the increased effort did not result in further big down moves. Nevertheless, price retested and broke below the low of the range reaching $44.76 on 5 July. This has characteristics of Wyckoff spring when the price subsequently initiated a Wyckoff sign of strength (SOS) rally.
The price broke above the $61 axis line on 12 Aug. It hit above $76 before retracing to test the $61 axis line several times. In the subsequent weeks of 2022, the price retested the $61 axis and the $76 resistance. It’s worth noting that the price was forming a higher low as a sign of accumulation.
ON continued on the bullish momentum with a SOS rally in 2023 that broke above the $76 resistance on 2 Feb. Subsequently there was some rejection at an all time high of $87.50 and price retraced to test $76. There was a localized increase in volume on 23 Feb suggesting the presence of supply and more testing might take place. The price did break the $76 on 2 Mar but quickly rallied back above that.
Bias
Bullish. According to the Wyckoff method, ON is now consolidating between $75 and $80 in the Wyckoff back up (BU) phase. There is no threatening supply volume and the pullback has been shallow, suggesting the bullish structure is still intact. The immediate target would be challenging $87.50 and beyond.
If the price breaks below $75, it will likely retest the swing low of $72 followed by $66 with a prolonged consolidation in the trading range.
ON was discussed in detail in my weekly live group coaching on 28 Feb 2023 before the market opened. Despite the sharp market correction due to the two forces as discussed in the video from last week (refer below), ON exhibited strong relative strength while the whole semiconductor group has been outperforming too.
Author

Ming Jong Tey
Independent Analyst
Ming Jong Tey has been trading since 2008. He started his learning journey from technical analysis (indicators, Fibonacci, etc...) to value investing. Throughout his journey, he develops an interest in price action with chart pattern trading.