NZD/USD technical analysis: Bull flag seen on the hourly chart
- NZD/USD's hourly chart shows a bull flag.
- A breakout could yield a rally to 0.6870.

NZD/USD seems to have created a bull flag, a bullish continuation pattern, on the hourly chart.
A break above the upper edge of the flag, currently at 0.6776, would confirm a flag breakout or a continuation of the rally from the July 16 low of 0.6694 and would create room for a rally to 0.6873 (target as per the measured move method).
The hourly chart relative strength index has already breached the descending trendline. So, a flag breakout could happen in the next couple of hours.
Also, the outlook as per the daily chart will remain bullish as long as the higher lows and higher highs pattern is intact. A daily close below 0.6727 (June 28 high) is needed to invalidate the bullish setup.
As of writing, the pair is trading at 0.6766.
Hourly chart
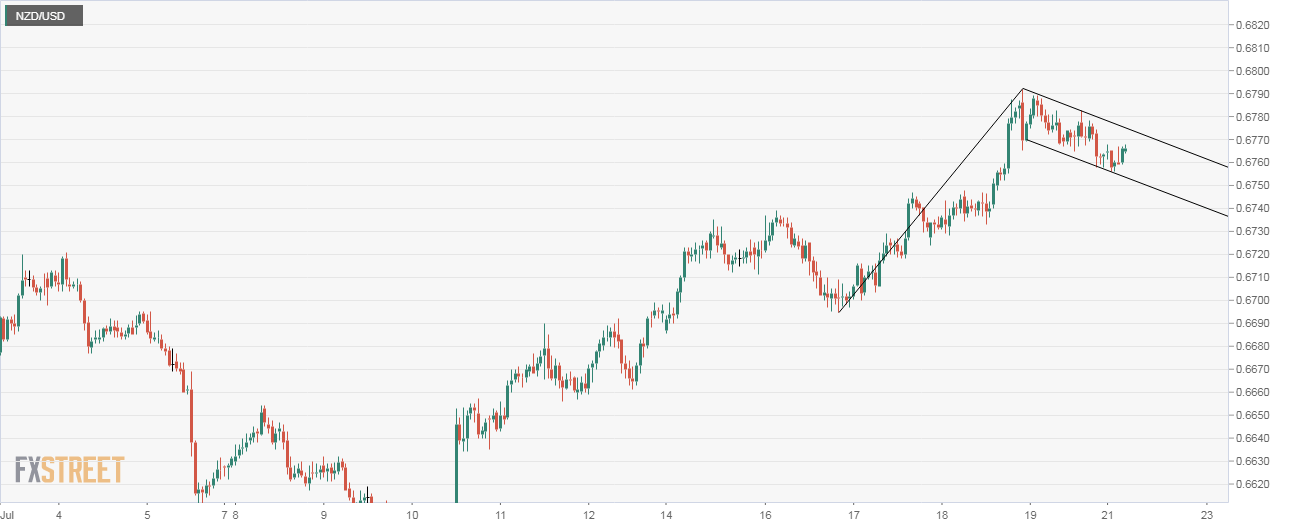
Trend: Bullish
Pivot points
Author

Omkar Godbole
FXStreet Contributor
Omkar Godbole, editor and analyst, joined FXStreet after four years as a research analyst at several Indian brokerage companies.


