NZD/USD retreats to 0.6030 lows with investors bracing for US CPI data
- The New Zealand Dollar retreated as the US-China deal failed to convince investors.
- The US Dollar is showing minor gains ahead of the US CPI release
- NZD/USD is showing signs, suggesting a potential trend shift.

The New Zealand Dollar is trading about 0.35% lower on Wednesday, with investors slightly disappointed by the lack of news of the US-China trade deal, while a soft US Dollar, ahead of the US CPI release, is keeping the Kiwi from dropping further.
US Commerce Secretary Howard Lutnick celebrated the agreement of a “framework” that will allow for lower tariffs and ease restrictions on rare earths trade. Investors’ reaction, however, has been less than enthusiastic amid doubts about the lack of details of the deal and concerns about its durability.
The US Dollar appreciated following news about the deal, but most of the gains were lost shortly afterwards. Investors remain wary that the US CPI report might confirm the inflationary impact of Trump’s “Liberation Day” tariffs and boost fears of stagflation.
NZD is forming an “Evening Star” candle formation
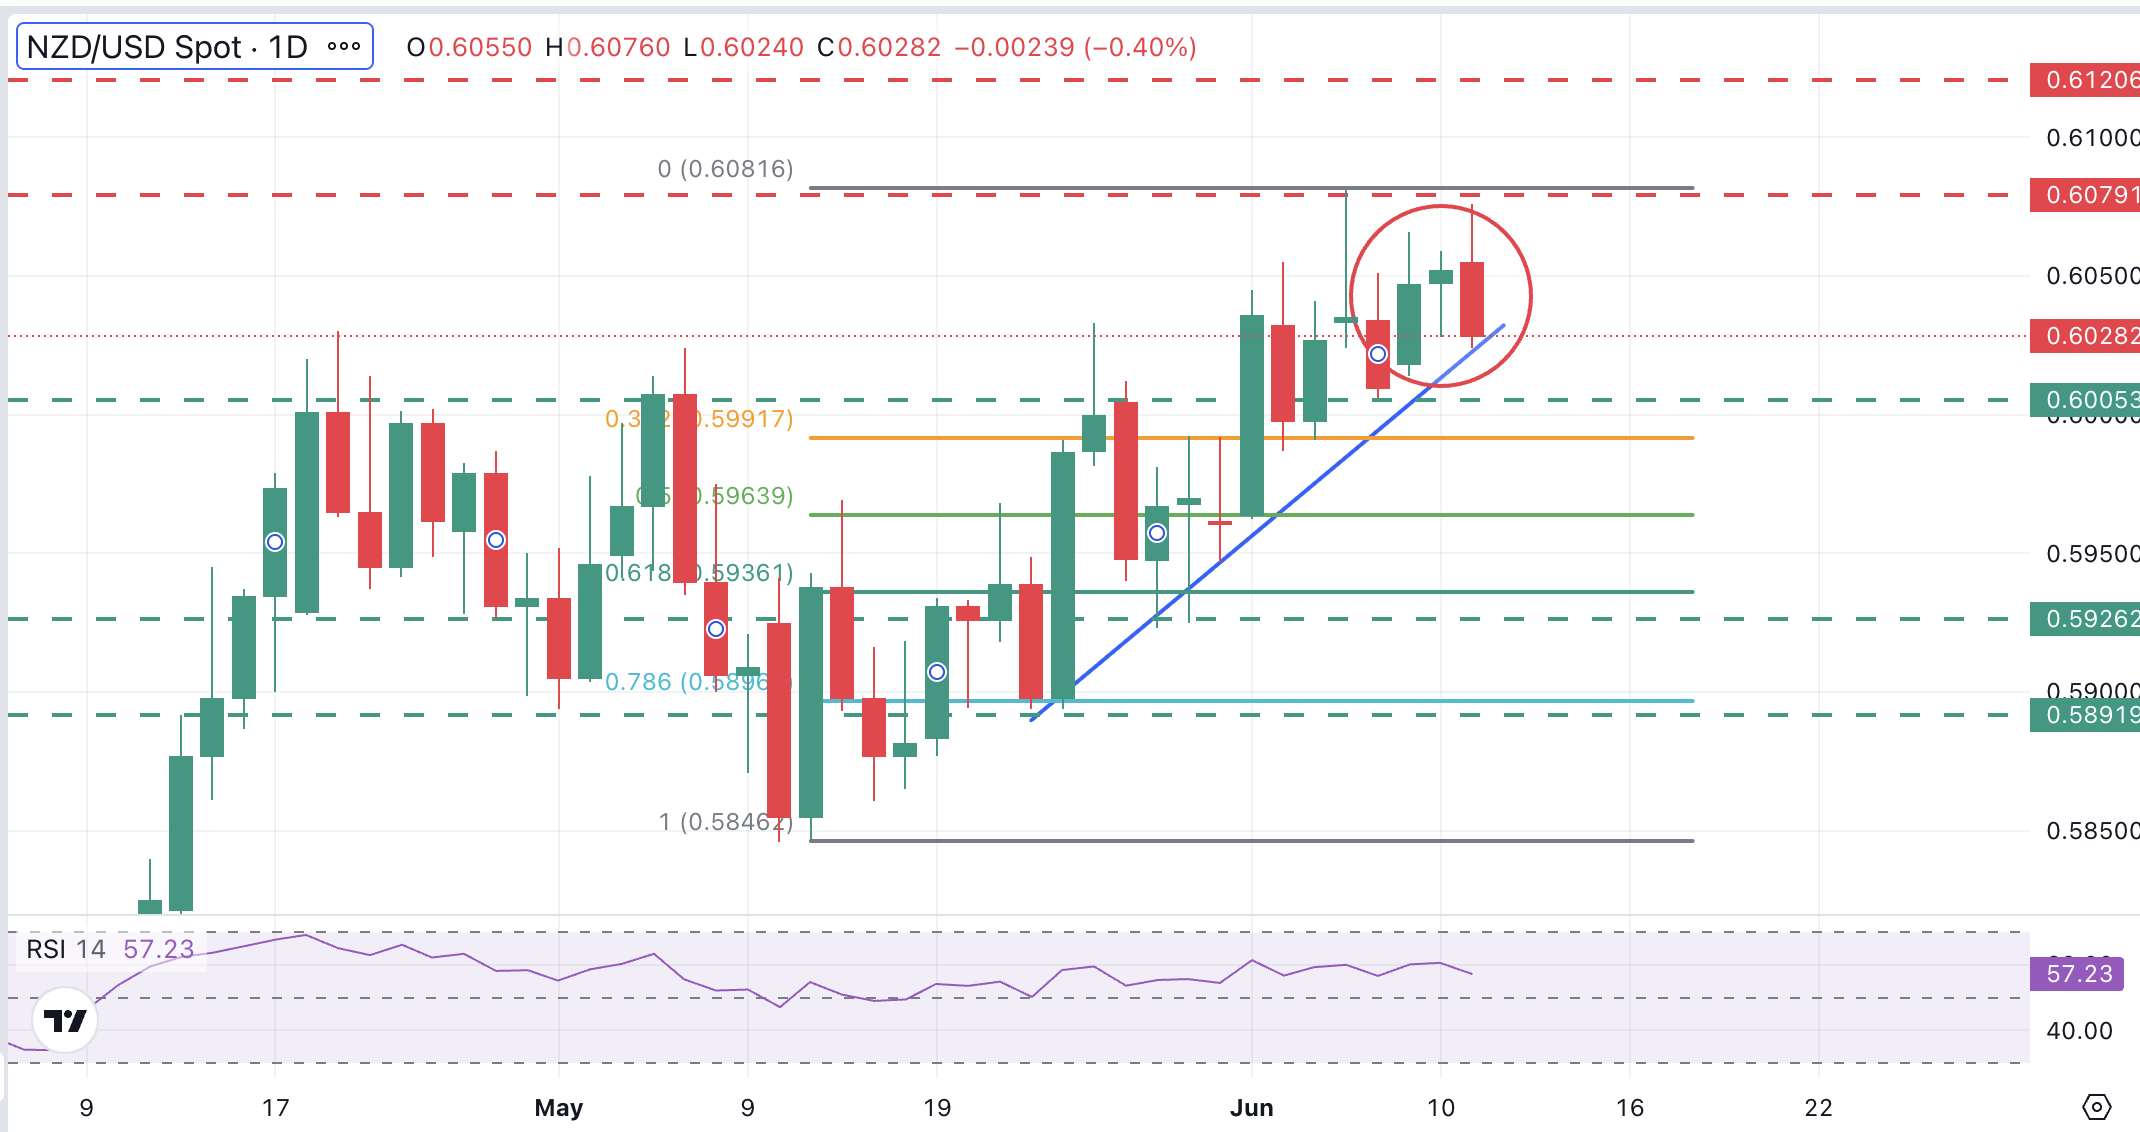
The Daily chart shows an “Evening Star” candle pattern and a potential double top at 0.6080, both negative signs that could be anticipating a bearish correction after the May-June rally.
The pair is now approaching the ascending trendline support from May 23 lows, at 0.6025, ahead of the neckline of the mentioned DT, at 0.6000. Further decline below these levels would confirm a trend shift and increase pressure towards the 5925 area, where the 61.8% Fibonacci retracement meets May 28 and 29 lows.
On the upside, a break of the mentioned 0.6080 cancels this view and clears the path towards mid-October 2024 highs, at 0.6120.
New Zealand Dollar PRICE Today
The table below shows the percentage change of New Zealand Dollar (NZD) against listed major currencies today. New Zealand Dollar was the strongest against the Australian Dollar.
| USD | EUR | GBP | JPY | CAD | AUD | NZD | CHF | |
|---|---|---|---|---|---|---|---|---|
| USD | -0.03% | 0.05% | 0.25% | 0.08% | 0.26% | 0.45% | -0.00% | |
| EUR | 0.03% | 0.07% | 0.27% | 0.10% | 0.28% | 0.43% | 0.02% | |
| GBP | -0.05% | -0.07% | 0.18% | 0.06% | 0.23% | 0.37% | -0.06% | |
| JPY | -0.25% | -0.27% | -0.18% | -0.27% | 0.02% | 0.18% | -0.28% | |
| CAD | -0.08% | -0.10% | -0.06% | 0.27% | 0.21% | 0.34% | -0.11% | |
| AUD | -0.26% | -0.28% | -0.23% | -0.02% | -0.21% | 0.15% | -0.27% | |
| NZD | -0.45% | -0.43% | -0.37% | -0.18% | -0.34% | -0.15% | -0.43% | |
| CHF | 0.00% | -0.02% | 0.06% | 0.28% | 0.11% | 0.27% | 0.43% |
The heat map shows percentage changes of major currencies against each other. The base currency is picked from the left column, while the quote currency is picked from the top row. For example, if you pick the New Zealand Dollar from the left column and move along the horizontal line to the US Dollar, the percentage change displayed in the box will represent NZD (base)/USD (quote).
Author

Guillermo Alcala
FXStreet
Graduated in Communication Sciences at the Universidad del Pais Vasco and Universiteit van Amsterdam, Guillermo has been working as financial news editor and copywriter in diverse Forex-related firms, like FXStreet and Kantox.


