NZD/USD Price Forecast: Tests confluence around 0.6000 barrier
- NZD/USD may target its initial barrier at 0.6000, followed by the ascending channel’s upper boundary around 0.6010.
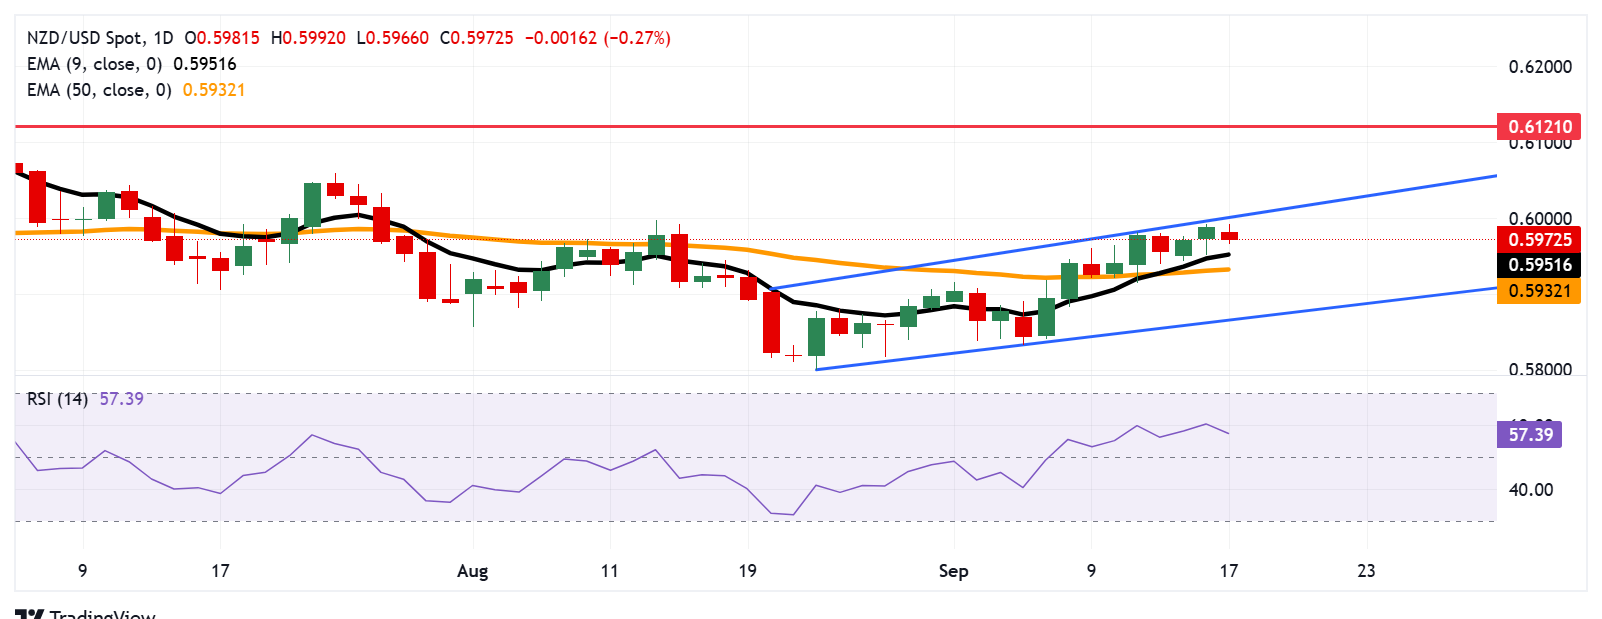
- The market sentiment remains bullish as the 14-day RSI stays firmly above the 50 mark.
- The primary support lies at the nine-day EMA of 0.5951.

NZD/USD depreciates after two days of gains, trading around 0.5970 during the European hours on Wednesday. The technical analysis of the daily chart indicates a strengthening bullish bias, as the pair moves upwards within the ascending channel pattern.
The short-term price momentum is stronger as the NZD/USD pair is positioned above the nine-day Exponential Moving Average (EMA). Additionally, the bullish bias strengthens as the 14-day Relative Strength Index (RSI) remains above the 50 mark.
On the upside, the NZD/USD pair may find its primary barrier at the psychological level of 0.6000, followed by the upper boundary of the ascending channel around 0.6010. A break above the channel would strengthen the bullish bias and support the pair to explore the region around the 11-month high of 0.6121, which was recorded on July 1.
The NZD/USD pair could find its initial support at the nine-day EMA of 0.5951, followed by the 50-day EMA at 0.5932. A break below the latter would dampen the bullish bias and put downward pressure on the pair to test the ascending channel’s lower boundary around 0.5870.
NZD/USD: Daily Chart
New Zealand Dollar Price Today
The table below shows the percentage change of New Zealand Dollar (NZD) against listed major currencies today. New Zealand Dollar was the weakest against the US Dollar.
| USD | EUR | GBP | JPY | CAD | AUD | NZD | CHF | |
|---|---|---|---|---|---|---|---|---|
| USD | 0.22% | 0.08% | 0.09% | 0.14% | 0.12% | 0.17% | 0.23% | |
| EUR | -0.22% | -0.15% | -0.12% | -0.06% | 0.02% | 0.08% | 0.00% | |
| GBP | -0.08% | 0.15% | 0.04% | 0.09% | 0.02% | 0.09% | 0.08% | |
| JPY | -0.09% | 0.12% | -0.04% | 0.03% | 0.12% | 0.07% | -0.02% | |
| CAD | -0.14% | 0.06% | -0.09% | -0.03% | 0.05% | 0.08% | 0.08% | |
| AUD | -0.12% | -0.02% | -0.02% | -0.12% | -0.05% | 0.07% | -0.02% | |
| NZD | -0.17% | -0.08% | -0.09% | -0.07% | -0.08% | -0.07% | -0.05% | |
| CHF | -0.23% | -0.00% | -0.08% | 0.02% | -0.08% | 0.02% | 0.05% |
The heat map shows percentage changes of major currencies against each other. The base currency is picked from the left column, while the quote currency is picked from the top row. For example, if you pick the New Zealand Dollar from the left column and move along the horizontal line to the US Dollar, the percentage change displayed in the box will represent NZD (base)/USD (quote).
Author

Akhtar Faruqui
FXStreet
Akhtar Faruqui is a Forex Analyst based in New Delhi, India. With a keen eye for market trends and a passion for dissecting complex financial dynamics, he is dedicated to delivering accurate and insightful Forex news and analysis.


