- NZD/USD could encounter immediate resistance around the nine-day EMA at the 0.6203 level.
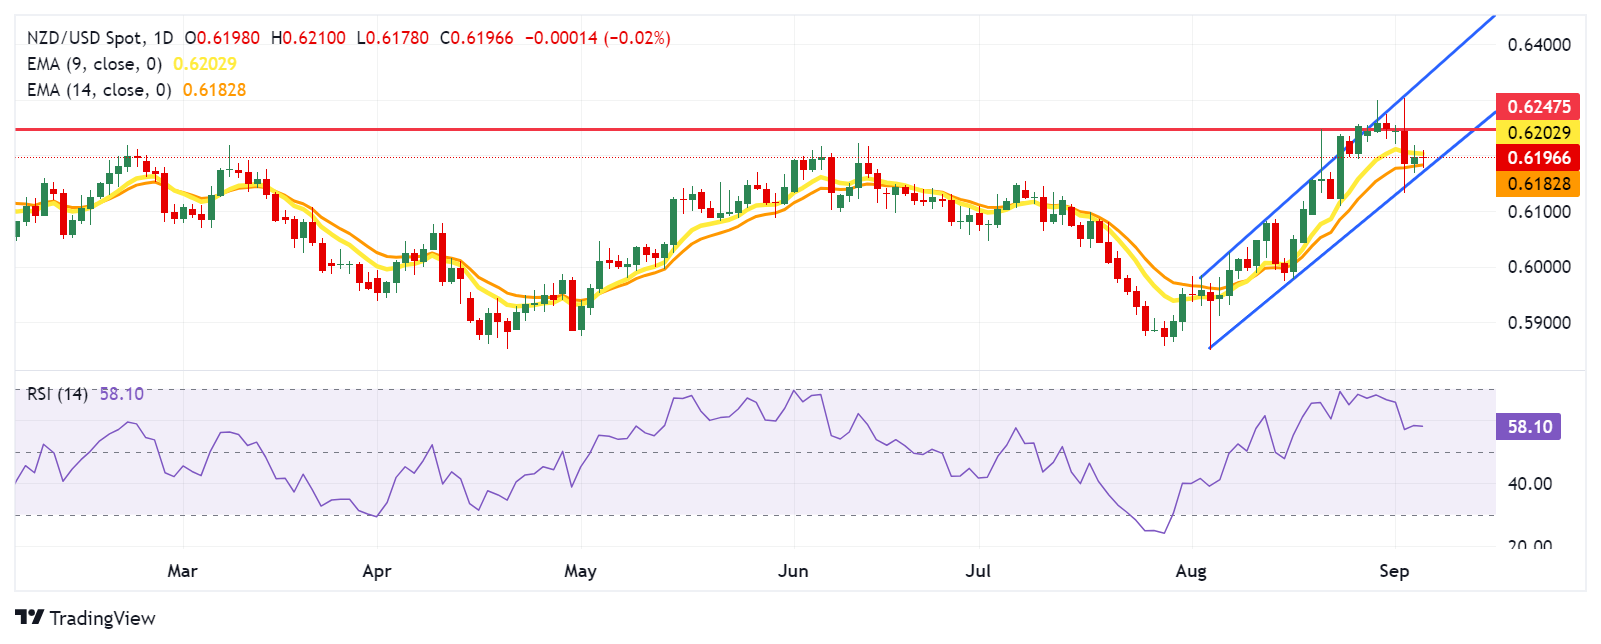
- The 14-day RSI remains above the 50 level, confirming the overall bullish trend.
- The immediate support appears around the 14-day EMA at 0.6180 level, aligned with the lower boundary.
NZD/USD holds its position around 0.6200 during the European hours on Thursday. On the daily chart, the pair is trekking above the lower boundary of the ascending channel, supporting a bullish bias. A break below the lower boundary would weaken the bullish bias.
The 14-day Relative Strength Index (RSI) remains above the 50 level, confirming the overall bullish trend. Additionally, the nine-day Exponential Moving Average (EMA) is positioned above the 14-day EMA, signaling that the NZD/USD pair is experiencing short-term upward momentum and is likely to continue rising.
On the upside, the NZD/USD pair may encounter immediate resistance around the nine-day EMA at the 0.6203 level, followed by the seven-month high of 0.6247, recorded on August 21. A break above this level could lead the pair to test the upper boundary of the ascending channel at 0.6330.
In terms of support, the NZD/USD pair may find immediate support at the 14-day EMA at 0.6180 level, aligned with the lower boundary of the ascending channel around the 0.6170 level. A break below this level could weaken the bullish bias and lead the pair to navigate the area around the psychological level of 0.6100.
NZD/USD: Daily Chart
New Zealand Dollar PRICE Today
The table below shows the percentage change of New Zealand Dollar (NZD) against listed major currencies today. New Zealand Dollar was the weakest against the Japanese Yen.
USD | EUR | GBP | JPY | CAD | AUD | NZD | CHF | |
---|---|---|---|---|---|---|---|---|
USD | 0.00% | 0.04% | -0.06% | 0.04% | 0.12% | 0.03% | 0.06% | |
EUR | -0.01% | 0.05% | -0.06% | 0.06% | 0.12% | 0.06% | 0.05% | |
GBP | -0.04% | -0.05% | -0.11% | 0.03% | 0.07% | 0.02% | 0.00% | |
JPY | 0.06% | 0.06% | 0.11% | 0.11% | 0.18% | 0.10% | 0.14% | |
CAD | -0.04% | -0.06% | -0.03% | -0.11% | 0.08% | 0.00% | 0.00% | |
AUD | -0.12% | -0.12% | -0.07% | -0.18% | -0.08% | -0.07% | -0.06% | |
NZD | -0.03% | -0.06% | -0.02% | -0.10% | 0.00% | 0.07% | 0.00% | |
CHF | -0.06% | -0.05% | -0.01% | -0.14% | -0.01% | 0.06% | -0.01% |
The heat map shows percentage changes of major currencies against each other. The base currency is picked from the left column, while the quote currency is picked from the top row. For example, if you pick the New Zealand Dollar from the left column and move along the horizontal line to the US Dollar, the percentage change displayed in the box will represent NZD (base)/USD (quote).
Information on these pages contains forward-looking statements that involve risks and uncertainties. Markets and instruments profiled on this page are for informational purposes only and should not in any way come across as a recommendation to buy or sell in these assets. You should do your own thorough research before making any investment decisions. FXStreet does not in any way guarantee that this information is free from mistakes, errors, or material misstatements. It also does not guarantee that this information is of a timely nature. Investing in Open Markets involves a great deal of risk, including the loss of all or a portion of your investment, as well as emotional distress. All risks, losses and costs associated with investing, including total loss of principal, are your responsibility. The views and opinions expressed in this article are those of the authors and do not necessarily reflect the official policy or position of FXStreet nor its advertisers. The author will not be held responsible for information that is found at the end of links posted on this page.
If not otherwise explicitly mentioned in the body of the article, at the time of writing, the author has no position in any stock mentioned in this article and no business relationship with any company mentioned. The author has not received compensation for writing this article, other than from FXStreet.
FXStreet and the author do not provide personalized recommendations. The author makes no representations as to the accuracy, completeness, or suitability of this information. FXStreet and the author will not be liable for any errors, omissions or any losses, injuries or damages arising from this information and its display or use. Errors and omissions excepted.
The author and FXStreet are not registered investment advisors and nothing in this article is intended to be investment advice.
Recommended content
Editors’ Picks

EUR/USD bounces off lows, approaches 1.1550
EUR/USD continues to recover ground lost and now extends the rebound to the 1.1550 zone on Friday. Meanwhile, the US Dollar maintain its bullish bias intact in response to a significant flight to safety amid increasing geopolitical concerns, while positive consumer sentiment data also contribute to the daily uptick.

Gold keeps the trade above $3,400 on safe-haven demand
Gold prices maintain its upward trajectory on Friday, reaching its peak level since late April above the $3,400 mark per troy ounce. Furthermore, the precious metal draws increased safe-haven interest amid escalating tensions in the Middle East, triggered by Israel's military action against Iran.

GBP/USD trims losses, retargets 1.3600
After an earlier dip toward the 1.3520 area, GBP/USD has regained some composure, trading within sight of the key 1.3600 barrier as the week draws to a close. The pair remains under pressure on Friday, weighed down by renewed US Dollar strength amid rising risk aversion and a stronger-than-expected consumer confidence report.

Crypto Today: Bitcoin, Ethereum, XRP clamber for support amid escalating volatility on Israel-Iran tensions
The cryptocurrency market has been hit by a sudden wave of extreme volatility, triggering widespread declines as global markets react to tensions between Israel and Iran. Bitcoin is hovering at around $104,668 at the time of writing on Friday, following a reflex recovery from support tested at $102,513.

Week ahead – Markets brace for central bank barrage amid heightened uncertainty
Fed officials to stand pat as they await further clarity. A dovish BoJ could push rate hike expectations into 2026. Deflation fuels speculation about negative SNB rates. BoE may sound more dovish after disappointing UK data.